
planet.freedesktop.org
While you (yes, you! no, not you, the one behind you) have been sweltering in the heatwaves of the northern hemispheres (Assisted-by: AI), I've been busy adding graphics tablet support to libei. This is scheduled for the soon to be released libei 1.7.0.
The initial work was done by Jason Gerecke and Josh Dickens from Wacom, I've been extending, polishing and testing it for the last few weeks.
Also, upfront: this only covers the stylus part of a tablet, we do not yet have an implementation for the "pad" part (the buttons, dials, rings, strips).
libei is, of course, the library for Emulated Input, a good-enough transport layer for sending logical input events between processes. We're already using libei as part of the XDG Portal Remote Desktop and Input Capture portals where we've been busy hurtling key and pointer events between the participating parties (and soon gesture events and text).
In the next release of libei, we will now also have "ei stylus" capabilities, i.e. the ability to send tablet stylus events. Getting pointer, keyboard and touch events supported was a long undertaking, everything was new and shiny and needed to be added everywhere in the stack. Now that all this is in place, scuffed and scratched, adding tablet events will be quite simple.
Here's a short outline of how libei handles tablet events because it is, of course, different to how libinput handles them. Logical events are much nicer after all than physical hardware events.
First: we have a new interface: "ei_stylus". An EIS implementation (e.g. your compositor) may provide you, the libei client, with a device that supports this interface and one or more associated regions (typically representing the available screen areas). Typically this will be a separate device to the pointer devices or the keyboard devices but it's not a requirement. The ei_stylus interface comes with a bunch of capabilities you'd expect from a stylus (tilt, pressure, distance, ...) that you can selectively enable to emulate the stylus you want to. So basically, EIS will say "here's a stylus device, I support pressure, tilt, rotation, ..." and then the libei client says "This stylus should have pressure and tilt but nothing else". And then you do the normal thing: send proximity events, send tip down/up events, send data for the various capabilities you've enabled.
Happily for the EIS implementation, libei forces the client to take the guesswork out of everything: if you select the pressure capability, you must send a pressure value when coming into proximity. Where libei is used to forward data from a physical stylus (e.g. via some remoting protocol) it is up to the client to deal with firmware bugs that e.g. won't send data until a few frames in.
Note that there is no "tablet" anywhere. The tablet is represented by the region that the device may interact with. So in some ways every tablet is an on-screen tablet (which makes sense since we have logical events).
The only quirky thing is how to request multiple styli[1]: libei 1.5.0 has added a "request device" request that allows a client to say "hey, EIS, I want a new device with capabilities pointer, keyboard, ...". And, if you've been a nice client, minding your own business, the EIS implementation may just create such a device for you.
So for the case of multiple styli: if the default stylus (if any) isn't good enough, you can now tell EIS that you want a(nother) device with stylus capability, configure the stylus capabilities once the device shows up and voila, you now have a normal pen, an art pen and maybe even an airbrush represented as logical device in libei. And since they're all separate devices in the protocol, they can be individually tracked and used, much like libinput tracks individual styli.
[1] For the "lots" of users that actually use multiple styli...
/me gestures vaguely at everything
Oh, hey, this works now? Great!
libei 1.7.0 (to be released soon) comes with a new interface: "ei_gestures" which, creatively, will allow for gestures to be sent between a libei client and an EIS implementation (typically: a Wayland compositor).I'm not going to go too deeply into how pinch, swipe and hold gestures work, suffice to say we've had those in libinput (for touchpads) for years now so compositors and toolkits should already support those. And since libei and libinput have vaguely equivalent API layers integrating gestures for libei devices in compositors should be fairly straightforward.
The plumbing layers in the portals exist already too, so adding gestures to libei means that - once the compositors support it - we can have gestures support in remote desktop and input capture implementations without needing to update anything else. Hooray! Join in with me. Hooray! Louder! HOORAY!
For testing I had a (vibe-coded and thus immediately abandoned once testing was complete) gesturemouse utility which translates input events from a mouse into gesture events (depending which button is down). But don't let my lack of be a limit to your imagination, I'm sure you can come up with good use-cases for this.
If you've been paying attention (and I know you have, because it'd be embarrassing for you if you didn't) you'd have noticed that libei 1.6 (May 2026) added support for keysym and text events.
libei sends logical events between a libei client and an EIS implementation (typically: a Wayland compositor) but the keyboard interface it had was designed like real keyboards: key codes together with an (XKB) key map. You press one key, the keymap decides what that key means on the compositor side and off we go. This is easy but not always useful.
As of 1.6.0 libei now also supports an "ei_text" interface. A compositor may choose to provide you[0] with a device that supports this interface and that gives you two really nice opportunities.
First, you can now send a key sym. Instead of sending the KEY_Q
key code and hoping it actually translates to 'q' (and if there's e.g. a
frenchman^Wfrenchperson lurking behind the keyboard it may mean 'a'), you can
now send 'q' as actual keysym. Or 'Q' instead of sending shift+q and
hoping for no french influence in the process. It becomes the EIS
implementation's job to handle that keysym - if it's a shortcut it may handle
it directly, otherwise it may pass it on via Wayland to an application[1]. This
centralises the keysym to keycode handling in the EIS implementation which is a
pain for compositor authors (though they likely have that code already for e.g.
RDP support) but reduces the variety of differently-wrong implementations in
clients and of course makes it so much simpler to write clients.
Second, a client can send UTF-8 text to the compositor. So instead of emulating shift, keycodes, etc. you can literally send "Hello World" and expect the EIS implementation to pass that one. Again, makes a bunch of utilities a lot simpler to write and I mostly leave it up to your imagination to figure out what to do with that.
Notably for both cases: libei is about logical events that have a specific meaning that do not need further interpretation. If a client sends 'Q' that means it is supposed to be an uppercase Q. Sending keysym Shift_L and Q makes little sense. And for the utf8 text events: how the text comes to be matters doesn't matter for libei so you may use an IM to make up the text to begin with and send it, once committed, to EIS. It's not for sending partial strings.
As mentioned in the previous post: the plumbing for this is already in place so both clients and compositors can add support for this new interface without having to bother the rest of the stack (e.g. portals). So, hooray I guess.
The text/keysym support is relatively recent so expect this to hit the next compositor version (or the one after that).
[0]: the EIS implementation decides which devices are available and arguing about
this is even less useful than arguing with a world cup ref
[1]: after converting it to a key code with possible keymap changes... but hey, such is life
Turns out it's been years since I've talked about eggs, so let's change this. libei is, of course, the library for Emulated Input[1].
This post is mostly a refresher because it's been so long and a short summary of some of the work we've done so far, in preparation for some more posts that come soon.
libei is a transport layer for logical input events, unlike libinput which is a hardware abstraction layer. In libinput's case the device's firmare/kernel pass events that are somewhere on the sanity spectrum, libinput tries to make sense of those and then we convert those to logical events to be consumed by the next layer (typically the Wayland compositor or Xorg). This is how e.g. "touch down at position x1/y1, touch up at position x1/y2" is converted into a button click event if touchpad tapping is enabled. Or maybe into nothing if we find it was an accidental palm touch.
libei works purely on the logical level - you as the libei client pass logical events to the EIS (Emulated Input Server) implementation (typically the compositor). No guesswork, you say button click, EIS gets a button click. libei supports a "sender" and "receiver" mode, depending on whether events are sent to the EIS implementation (input emulation) or receive from the EIS implementation (input capture). libei is designed for the Wayland stack but there are zero requirements for Wayland on either the client or the EIS implementation.
Core to libei's design is that the EIS implementation is in control of virtually everything, it decides which devices are available to the client, when those devices can send events, etc. Much like the compositor is in charge when it comes to physical devices - if a compositor decides a physical device doesn't exist, a Wayland client cannot get events from it.
Since the original proposal (again, [1]!) we've been busy bees and libei is now a part of the XDG Remote Desktop portal and the XDG Input Capture (both since version 1.17, mid 2023). In both cases the portal is for the negotiation and initial agreement of what should happen, libei is then used as the transport layer between the two processes [2].
More recently we also added session persistence support so you don't have to allow access on every connecton. Much of the work enabling this was done by Jonas Ådahl, it is now in the portals since version 1.21.0 and should be in the major compositors in the current or next versions.
Getting all this into place was a huge amount of work across several pieces of the stack. This isn't exciting in the same way as laying plumbing pipes isn't particularly exciting but much like regular plumbing: once it's in place you can change your diet without severely impacting everyone again. Try get that analogy out of your head now. You're welcome.
In libei's case this means three things:
An example for such a case where we can now abuse the piping is Xwayland support for XTEST. XTEST is the protocol that everyone uses to emulate input under X but in Wayland it's not hooked up to anything so those APIs simply won't work.
But what we can do in Xwayland is translate XTEST to libei events and facilitate the portal interaction. This means our stack looks roughly like this:
    +--------------------+             +------------------+
    | Wayland compositor |---wayland---| Wayland client B |
    +--------------------+\            +------------------+
    | libinput |   EIS   | \_wayland______
    +----------+---------+                \
        |          |           +-------+------------------+
 /dev/input/       +-----------| libei |     XWayland     |
                               +-------+------------------+
                                                |
                                                | XTEST
                                                |
                                         +-----------+
                                         |  X client |
                                         +-----------+
And if said X client uses XTEST to try to emulate devices, Xwayland will
ask the Remote Desktop portal for permission and set up the session, then pass
the XTEST events on as libei events and voila - your 20 year old X client can
send pointer and keyboard events through an XDG Portal without knowing about
it (and the user can prohibit this and even gets some information on who is
sending events which is not possible with normal XTEST at all). This has now
been supported since Xwayland 23.2.0. Compositors don't need extra support for
this.
So we have a lot of the plumbing in place, or in another anology: we have a hammer, let's go looking for nails. And right now the nails we can see are sending text, gestures, and tablet support. And those will be the subject of the next few posts.
[1]: 6 years ago?! whoah...
[2]: in Remote Desktop's case replacing the DBus emulation APIs which were a Newton's Cradle of wakeups for at least 4 processes per event
The Linux desktop has an upstream maintenance problem due to many reasons for it, such as the lack of paid work. No one is entitled to a volunteer’s free time apart from the volunteer themself. This is especially true to volunteers working on upstream projects, as they are at the mercy of downstream distributions, who have the final say.
As an upstream contributor, you have no choice but to meticulously plead for any reasonable request to be granted by difficult downstreams, treating them as if they are some kind of deity. Not doing so with the utmost respect can get you on their naughty list, which they can then use against you just because the license ‘allows’ it and they can get away with it; even shamelessly use the ‘you chose the wrong license’ card when they have nothing else to add.
We have seen several instances of downstreams misusing their power while simultaneously abusing upstreams’ generosity and free time to do whatever they want. This was especially true with XScreenSaver and Debian in the past, which Debian has since changed its policies to communicate better with upstreams, and more recently Bottles, OBS Studio, and Fedora. This article is specific to an even more recent incident we at GNOME Calendar have had with Linux Mint.
There are a few technical definitions that should be understood before reading the rest of the article:
Distribution model refers to an established model that the Linux desktop has been practicing for decades, where an end user is expected to report issues to downstream, and, if necessary, downstream relays said issue to upstream.
The adage that users report issues to downstream holds true up until these users start reporting them to upstream without reporting to downstream beforehand. In reality, many distributions advertise themselves as user-friendly. Users of these distributions are unaware of the distribution model, so, in good faith, they report issues to upstream without ever knowing that they should be contacting downstream.
Often, downstream issues have already been resolved in previous releases; however, since these issues are being reported to upstream, upstream has to regularly triage and close these invalid issues. This creates an additional burden for them because they end up spending their limited volunteer time managing these issues when it should have been downstream’s responsibility to ensure that the user is reporting to them first.
Whenever the upstream project reaches out to the hostile downstream and asks for a change, the response is usually met with the downstream bluffing by pretending to look for a solution for a nonexistent request, such as adapting the issue tracker with the implication that upstream will have to write the template(s) themselves, and then regularly update when the message is misinterpreted, just so downstream can avoid doing any actual work. That is called moving the goalposts.
If upstream objects to these ‘suggestions’, this is usually done with a shift in tone, as these one-sided discussions occur in the span of weeks, if not months, if not years, which quickly drains upstream’s remaining energy. When it shifts to a harsh(er) tone, the hostile downstream takes the easy way out by making remarks on that tone and acting like they are the only one being dignified; when they can, they end the discussion just because they do not like the tone and can use that tone to justify their (lack of) decision, without taking any appropriate action to remedy the underlying request.
As a result, they continue to mislead users into reporting issues to upstream, but this time intentionally and out of spite simply because free software licenses do not disallow abusing people’s generosity and free time. However, you will see later that this has nothing to do with free software.
For years, we have been dealing with users reporting Linux Mint’s broken packaging of GNOME Calendar to us, that were either never present or addressed releases ago.
To name a few examples:
There were a couple of discussions regarding this in the past, in chat and without my involvement, but none of them ended up being productive. Eventually, we got fed up by it and I opened ticket #1 on Linux Mint’s “gnome-calendar” repository, asking them to remove all links pointing to upstream GNOME Calendar and rebranding the app:
Remove/replace links pointing to GNOME Calendar, and update branding
Being one of the core developers of GNOME Calendar, we do not support any of the versions provided and held back by Linux Mint. We would really appreciate if you could remove or replace every link, especially support links, targeting to GNOME Calendar, as well as rebranding the app icon.
Mind you, this is the first issue ever opened in the history of Linux Mint’s package repository (8 years ago)! Based on the links above, I think it is safe to say that the app was broken throughout these years despite the lack of tickets.
This ticket had no response for six months, in other words half a year, all the while we were still getting bug reports about their broken package.
We eventually got fed up (again!) and pinged the packager. The packager replied and asked which modifications we did not like, conveniently ignoring our actual request.
So, I stated that we do not have the time to look through the code just to pinpoint specific issues, so I loosely said “everything”; then followed up by stating that the only solution to this is to rebrand or drop the package.1 (Of course, it should not be our responsibility as an upstream to pinpoint issues to downstream’s mispackaging.)
Then, the packager responded with “I reviewed the changes. None of them are problematic.”, ignoring the essence of my comment once again, and followed with a whataboutism:
[…] [GNOME Calendar] 46 and 48 are used by millions of people right now in Ubuntu LTS and Debian Stable. Are you going to request Debian and Ubuntu stop shipping GNOME apps?”
In other words: “what about Ubuntu LTS and Debian Stable?”, essentially roping Ubuntu and Debian into Linux Mint’s problem. As a bonus, they also twisted my words and changing the subject from “GNOME Calendar” to “GNOME apps”.
So, once again, I reminded that this is not what the issue is about, and Debian and Ubuntu LTS have nothing to do with this.
As a side note: no, never would we go after Debian or Ubuntu over this. If the distribution in question is doing its job properly by simply not bothering the people writing the software that they package, then why should we go after them? They are not the ones misleading users into opening in the wrong place, so there is no reason for us to be upset about. In this case, Linux Mint is leeching off of Debian, pushing their responsibility onto us, and roping Debian into their problems.
The packager then explained the following:
If we were to stop packaging GNOME Calendar, Mint users would end up with the exact same version 46 as now. You understand that? It wouldn’t magically upgrade their version of GNOME Calendar to 50+.
Very clear signs of strawman to make points against a proposal/demand that was never made, by arguing against ‘stop packaging GNOME Calendar’ rather than the original ‘rebrand GNOME Calendar’.1
Then:
Mint 22.x is built on top of Ubuntu 24.04 LTS. Packages come from both repositories. If there’s no gnome-calendar in Mint 22.x repositories, Mint 22.x users get it from the Ubuntu 24.04 repositories. The version in both repositories is 46. Removing gnome-calendar from our repositories would basically make our users switch to Ubuntu’s version, which is 46 as well.
Same goes for LMDE and Debian Stable, same principle, same bug fix, with version 48.
The only way to make it so Mint doesn’t have a frozen version of gnome-calendar would be to remove it from Debian. It would then disappear from future versions of Ubuntu and Mint which are based on it. If you got it removed from there we’d obviously oblige with your request not to re-add it and wouldn’t do so.
These are, again, unrelated problems to the essence of the request, as the request is about rebranding, not dropping the package altogether.
So, I again reminded them that this is not our responsibility as an upstream to fix their problems.
They then ‘suggested’ us to add code to check if the user is running an outdated version, and then ‘offered’ that they will patch their existing packages and potentially Debian’s and Ubuntu’s as well, essentially moving the goalposts once again. They’re expecting us to either phone home or somehow keep track of releases every six months.
If we were to phone home, we would need to cover more cases, such as bothering designers to find an appropriate way to display a warning to the user when they are not connected to the network or when the “gnome.org” domain is unreachable. This adds another dependency on the network for no reason.
This also adds more burden to translators: this is not a typical string where one needs to translate one word into another; the tone and vocabulary of a warning depends on the region, so translators need to adapt the vocabulary to ensure that the underlying meaning is not misinterpreted. In any case, I think it is fair to say that this is an absurd suggestion to a problem that has nothing to do with the upstream.
I lost my patience; I hostily replied that we as upstream do not care about how distributions operate, and, once again, reminded that all we want is for them to rebrand; a very simple request that was continuously red herred with bikeshedding, strawmen, whataboutisms, and moving goalposts.
When I posted that comment, I misinterpreted the message as I thought their ‘offer’ was them asking us to do their work, hence me stating that we do not care about how distributions operate.
The packager then replied: “If you don’t care, then neither do we.”; here, they are explicitly confirming that they do not care about Debian and the situation altogether. In a later comment, they stated: “probably requires GNOME Calendar to move away from free licenses” and locked the issue, which, once again, completely ignored the essence of this entire issue, but this time concluding with the ‘you chose the wrong license’ card.
Now, they were explicitly told what the problem was, have refused to act on it by continuing to shove their responsibilities onto us. The attitude went from doing something ‘just because they can’ to ‘that should show upstream for hurting my feelings!’, never mind the fact that we and Debian are the ones doing the hard work, which they are leeching off.
If you read through the entire ticket, you may notice a part where the packager makes a comment regarding some serious accusations. This is a response to a banned user’s comment that is now deleted, who originally made these accusations.
In addition to generally shipping outdated versions of everything, the packager has conveniently ignored some past changes around and on GNOME Calendar:
This can be seen in various blog posts from Mint, such as the ones cited below:
In Mint 22 GNOME Font Viewer was removed and the following applications were downgraded back to GTK3 versions:
- Celluloid
- GNOME Calculator
- Simple Scan
- Baobab
- System Monitor
- GNOME Calendar
- File Roller
- Zenity
These applications are very likely to be forked in the near future, except for Zenity which we’ll probably stop using altogether.
— https://blog.linuxmint.com/?p=4675
With the release of Linux Mint 22, GNOME Apps which used libAdwaita were downgraded back to their GTK3 versions so that they could continue to function properly in the desktop environments we support. This was a temporary solution until these applications either got replaced, removed, forked, or until we found a way to continue to use them.
— https://blog.linuxmint.com/?p=4840
libAdwaita apps and patches
Starting with Linux Mint 22.2, libAdwaita will be patched to work with themes. Support for libAdwaita was added to Mint-Y, Mint-X and Mint-L.
The following apps will be upgraded to their libAdwaita versions:
- gnome-calendar
- simple-scan
- baobab
libAdapta fork
In the scope of XApp and for our own projects, libAdwaita was forked into libAdapta
— https://blog.linuxmint.com/?p=4850
As explained above, this actually has nothing to do with free software; rather, this is a question about trademarks: Linux Mint is allegedly2 (mis)using GNOME’s name by redistributing unsupported builds while pretending that they are supported by us, and is actively misleading users to avoid supporting them.
Offending distributions use the ‘you chose the wrong license’ card because it is simultaneously very difficult to correct them as a non-lawyer, while being looked positively throughout the free software community. However, they know very well that looking at the situation from the perspective of trademark usage rather than software licensing would make it significantly harder to defend themselves, so naturally they opt into using (the incorrect) free software licensing as a gotcha.
GNOME Calendar is licensed under GPL-3.0-or-later, so let’s look at what the license states:
For both users’ and authors’ sake, the GPL requires that modified versions be marked as changed, so that their problems will not be attributed erroneously to authors of previous versions.
[…]
The work must carry prominent notices stating that you modified it, and giving a relevant date.
[…]
Notwithstanding any other provision of this License, for material you add to a covered work, you may (if authorized by the copyright holders of that material) supplement the terms of this License with terms:
[…]
- Prohibiting misrepresentation of the origin of that material, or requiring that modified versions of such material be marked in reasonable ways as different from the original version; […]
Here, the license states that 1. the modified versions (Mint) must be marked as changed so that future problems are not mistakenly attributed to the original authors (GNOME Calendar), 2. the changes must be explicitly stated in modified versions, and 3. the modified version must not misrepresent the authors’ work.
Linux Mint has not stated any changes, nor have they deviated from the GNOME brand. This can be seen in the metadata file where it is identical to the metadata provided in GNOME Calendar 48.1 In their website, they show a screenshot of the GTK3 version of GNOME Calendar, but call it “GNOME Calendar” which it is not, thanks to their modifications. Seeing the non-exhaustive list of examples of bug reports and posts on social media we have seen, I think it is fair to say that their problems are attributed erroneously to us.
Even then, besides all this, we put in the effort to go through Mint’s website and source code to list these problems, not Mint. This should not have been our responsibility to begin with.
The issue itself was originally calm and straight to the point. Half a year passed by and there was no response. Then, the packager was pinged, they chimed in, and changed the subject immediately. The tone shifted, and they took the easy way out by locking the issue and misleadingly stating that this is an upstream problem for choosing the wrong license.
In other words, you have two choices:
As an upstream, it is a lose-lose situation with hostile downstreams such as Linux Mint. Once they start packaging your software, they immediately burn their bridges implicitly. In order to show that they are ‘good’, they only pretend to care about the problem, and keep proposing ‘solutions’ that 1. have nothing to do with the underlying problem, and 2. put on significantly more burden to upstream without putting an equal amount of effort themselves.
The reason there are so little undocumented cases is because many maintainers who deal with hostile downstreams are usually indie-developers that have very little resources and energy to deal with these problems, and have very little to no understanding with trademarks and legality.
They get burned out, stop developing and contributing to free software, and (rightfully) lose hope for the Linux desktop. They do not make any of it public or make a fuss about the situation because they do not feel comfortable to be in the middle of a conflict publicly. All they want is to just enjoy providing goods to the world, but are unfortunately bullied by repackaging fetishists whenever they raise a legitimate issue.
To summarize all this, hostile downstreams have already gone as far as to burn their bridges with upstreams. Any upstream is at a lose-lose position no matter how kind or unkind they are. If they are kind, they will be on the waiting list for as long as governments put patients on the waiting list for medical care. If they are ‘rude’, hostile downstreams will use this tone against them. If upstream sends out a cease and desist letter, the free software community will start seeing them as the Nintendo of free software and conflate volunteers who are fed up with hostile downstreams, with corporations that sue every sentient being that breathes.
Among Arm's portfolio of IP blocks is the Ethos-U product line, offering acceleration of neural networks at low power and low latency. Arm calls them micro NPUs and though they indeed contain lower numbers of compute units, in my testing they can match the performance of NPUs with up to six times more compute units. In my opinion this is due to a very clean architecture in which the different sub-blocks fit very well with each other, and an excellent software stack that allows for very decent occupancy rates.
Of the SoCs supported by the mainline Linux kernel and containing a Ethos-U NPU, the most popular is NXP's i.MX93, which contains an Ethos U-65 with an advertised 0.5 TOP/s and 640 KB of SRAM.
 |
| The author's desk got messier by one board |
Arm's software stack to go with their IP includes on the low-level side a firmware running on a companion Cortex-M core, an out-of-tree kernel driver and a compiler called Vela that lowers a hardware-independent machine learning graph to the commands that the hardware understands. Their software stack also includes complete and high-quality hardware documentation that made the implementation of the mainline driver much more efficient.
In my conversations with SoC vendors, the mediation of the Cortex-M meant that the ML models couldn't co-execute efficiently on the CPU and NPU, and was cumbersome for their customers to deploy new models.
The other concern that I heard from SoC vendors and some of their customers was that even though Arm's software stack for the Ethos-U was open source, it wasn't pre-integrated in the Linux distributions that they were using, and there wasn't a standard path for contributing changes back as there is in established, multi-vendor open-source upstream projects.
To solve this deployment friction and eliminate the need for firmware mediation, the community turned to the mainline Linux kernel.
Rob Herring, widely known in the Linux community from his work on the Device Tree infrastructure, started a completely new kernel driver a bit over a year ago in the DRM/Accel subsystem that would drive the Ethos-U directly from the main CPU, bypassing the Cortex-M and thus the need for firmware. The driver uses the established DRM practices for UAPI and reuses code from the DRM subsystem such as GEM and gpu-drm-scheduler. This driver was merged into the 6.19 version of the Linux kernel, supporting right from the start the i.MX93 SoC from NXP.
In parallel, I started work on the Mesa side, where the userspace portion of DRM drivers are developed. Mesa already contained at that point support for the NPUs from VeriSilicon/Vivante and those found in Rockchip SoCs, so it was quite straightforward to add a third one. The userspace portion of the driver is in charge of translating the machine learning model into the programming of the accelerator hardware, typically divided into hardware configuration and data payloads such as operator coefficients which can be highly compressed.
The hardware drivers in Mesa share code in the form of backends for machine learning frameworks and the related testing and profiling infrastructure. Right now Mesa contains a TensorFlow Lite delegate and a PyTorch/ExecuTorch backend is in development.
The Ethos-U architecture is very clean, as mentioned above, and allows for easy implementation of new operations as used in ML models. Below are the operations currently implemented, as needed by the models that are currently supported and under regression testing.
| NPU opcode | TFLite operations |
|---|---|
| NPU_OP_CONV / NPU_OP_DEPTHWISE | Convolution, Fully Connected |
| NPU_OP_POOL | Max and Average Pooling |
| NPU_OP_POOL (NOP) | Concatenation, Strided Slice, Resize |
| NPU_OP_ELEMENTWISE | Add, Mul, Maximum, Minimum |
| NPU_OP_ELEMENTWISE (LUT) | Logistic, Tanh, HSwish, Leaky Relu |
| (fused / passthrough) | Pad, Quantize, Reshape |
Among the features that the mainline driver stack already supports are:
When using TensorFlow Lite for inference, the models below are supported:
| Model | Operations | Operation types |
|---|---|---|
| MobileNet V1 | 31 | Conv2D, DWConv, Reshape, Softmax |
| MobileNet V2 | 65 | AvgPool, Conv2D, DWConv, Reshape |
| SSDLite MobileDet | 125 | Concat, Conv2D, Custom(Detect), DWConv, Logistic, Reshape |
| SSD MobileNet V2 | 111 | Concat, Custom(Detect), DWConv, Dequant, Logistic, Quantize, Reshape |
| YOLOX Nano | 154 | Concat, Conv2D, Logistic, MaxPool, Mul, Reshape, ResizeNN, ScatterNd, Slice, Sub, Transpose |
| EfficientDet Lite0 | 267 | Concat, Conv2D, DWConv, Dequant, GatherND, Logistic, MaxPool, Pad, Reshape |
| Inception V1 | 83 | AvgPool, Concat, MaxPool, Reshape, Softmax |
| MicroNet Large | 14 | AvgPool, DWConv, Reshape |
| MoveNet Lightning | 157 | ArgMax, Concat, Conv2D, DWConv, Dequant, Div, FloorDiv, GatherND, Logistic, Mul, Pack, Quantize, Reshape, ResizeB, Sqrt, Sub, Unpack |
| MoveNet Thunder | 157 | ArgMax, Concat, Conv2D, DWConv, Dequant, Div, FloorDiv, GatherND, Logistic, Mul, Pack, Quantize, Reshape, ResizeB, Sqrt, Sub, Unpack |
More recently, support for the Ethos-U85 generation was added, as included in Arm's hardware simulator and in SoCs such as Alif's Ensemble E8. This version of the NPU IP contains improvements intended for more efficient support for transformer-based models, such as VLMs and LLMs. With the upcoming support for ExecuTorch in Mesa, users will be able to use PyTorch to optimize models for this hardware and ExecuTorch to deploy them to their edge/IoT hardware.
Important upcoming work includes performance improvements that will target reduced total memory usage and bandwidth and maximization of SRAM usage.
This year was the fourth year in a row that a bunch of display driver and compositor developers met for the Display Next Hackfest, to discuss, present, and tackle issues related to displays, GPUs, and compositors. Thanks to Collabora (Robert Mader and Mark Fillion specifically) for continuing this tradition!
(Check out the 2025 edition)
This time we met in Nice, France, after Embedded Recipes and right next to the PipeWire and libcamera hackfests. I took the opportunity to have a chat with the PipeWire developers about Flatpak, Portals, and the direction we would like to take in regard to video and audio access. Arun Raghavan has a nice summary if you’re interested.
That also brings me to another point: I have mostly stopped working on compositor and color-related areas. It’s not because I lost interest, but rather that I took over Flatpak and Portals maintenance. That by itself was taking a big chunk of time, but then LLMs became good at finding security vulnerabilities and now this takes more time than I have.
Before the hackfest, I sat down for one week and hacked on Mutter (the GNOME Shell compositor) to create a prototype with all the changes I wanted to do but never found the time for:
With the prototype done, I made my way to Nice, taking a sleeper train from Paris and waking up to the Côte d’Azur in the morning. Then I met with Robert in the botanic garden, where he used his deep cross-stack offloading knowledge to test a bunch of video playback scenarios.
Over the hackfest days we found some glitches in the AMD driver, which were promptly fixed by Harry Wentland. We also had some discussions on strategies to do KMS color pipeline offloading, which prompted some changes in the prototype, and now have something we can start upstreaming.
For the KMS color pipeline, we got a new fixed matrix operation for YCbCr to RGB conversion, and new named curves for important video playback cases. We talked about control over the color format on the cable (which has been merged by now), as well as control over the minimum BPC.
Another thing that we all got annoyed by was all the funky colors our in-kernel console became when our offloading worked a bit too well. We’ve wanted a reset mechanism for KMS for a few years now anyway, so we decided to prototype it and test it on Smithay. Proper patches are now on the mailing list thanks to Maxime Ripard.
Mario Limonciello managed to push out patches for backlight support via KMS before the hackfest – another thing we’ve wanted for years. We tested them on Mutter, and KWin added support for it as well.
Xaver Hugl showed that we can easily support AMD FreeSync Premium Pro, the worst name for a feature that is essentially Source-Based Tone Mapping (SBTM). We also got good news regarding SBTM on HDMI. In general, it looks like we might finally get HDR that isn’t entirely awful.
DisplayID, the replacement for EDID, is going to become much more prevalent, and we discussed how we’re going to roll out support in the kernel and in libdisplay-info.
We once again managed to put enough wayland developers in a room for a bigger protocol change to get merged. This time it was multi device dmabuf feedback which made Victoria Brekenfeld happy.
There was a lot more happening — check out Xaver’s and Louis Chauvet’s blog posts.
Even though I wasn’t as prepared as the previous times, it was very productive and there was more actual hacking this year. I also enjoyed meeting everyone again a lot, hanging out in the water while watching the 1% take off in their private jets, struggling to find an adequate Döner, and eating lots of pizza.
Until next time!
On June 19 we released systemd v261 into the wild.
In the weeks leading up to that release (and since then) I have posted a series of serieses of posts to Mastodon about key new features in this release, under the #systemd261 hash tag. In case you aren't using Mastodon, but would like to read up, here's a list of all 27 posts:
ConditionFraction=console= Initialization from UEFIbootctl linksystemd-sysinstallsystemd-boot A/Bkexec Handoversystemd-repart's BlockDeviceReplace=.rr Drop-ins for systemd-resolvedsystemd-report-cgroup & systemd-report-basicvarlinkctl serveconfext& sysextfrom the ìnitrdextra stanza in UAPI.1 Boot Loader Specificationsystemd-oomd Rules FIlesI intend to do a similar series of serieses of posts for the next systemd release (v262), hence if you haven't left tech Twitter for Mastodon yet, now is the opportunity. My series for v262 will begin in a few weeks most likely, under the #systemd262 hash tag.
In case you are interested, here is the corresponding blog story for systemd v260, here for v259, here for v258, here for v257, and here for v256.
From 2021 to 2023, I was really motivated to write articles regularly, but that is no longer the case. Most of my energy goes into programming nowadays. Whenever I try to write about a complicated topic in a digestible manner, I quickly lose motivation and don’t publish it.
For half a year, I’ve been trying to write an article about the thought process that went through when making the month view in GNOME Calendar accessible, as well as the implementation details. However, explaining complicated technical details into something that is simultaneously digestible to non-developers interested in accessibility and free and open-source calendar application developers requires me to withdraw my knowledge and assumptions, consider the perspective of someone who is not knowledgeable in this topic, and then recall the events that led me to take certain decisions, which demands a lot of energy.
Due to a lack of motivation, I want to try a different approach. I am calling this approach “draft-driven blogging”. Instead of publishing articles once they are complete, I will publish the draft publicly. This draft may contain keywords, incomplete sentences, random notes, empty sections and other characteristics that are only found in drafts. I will then iteratively improve the draft until it is considered finished.
This approach makes sense to me in terms of publishing and getting things done. I tend to seek perfection, which is great for maximizing quality, but it comes at the cost of motivation. Without external pressure, I am not motivated to fix something if it is not already publicly available. Seeing an unfinished blog post publicly is simply appalling. As it’s ugly, it motivates me to fix and complete it. So, instead of writing and publishing the ‘perfect’ article, I publish the ugly draft and complete it out of spite. Maybe “spite-driven blogging” is a better term for it?
Of course, communication is important. With drafts, I will add a disclaimer stating that the article in question is a draft. The published date will be the date of the last edit, and all previous drafts will be deleted. To avoid spamming RSS feeds and notifications, I will try to republish drafts infrequently.
It’s all an experiment; it might work well, or it might not. I might keep this approach or just pretend that I never tried it in the first place. We’ll see.
Two more dEQP tests down:
dEQP-GLES3.functional.fbo.blit.rect.nearest_consistency_mag -- Pass
dEQP-GLES3.functional.fbo.blit.rect.nearest_consistency_min -- Pass
This one was a fun geometry puzzle.
Mesa’s u_blitter is the utility that drivers use for framebuffer blits – copying pixel data between surfaces, optionally scaling and filtering. It works by drawing a textured quad: set up the source as a texture, the destination as a render target, and draw a rectangle with the appropriate texture coordinates. Simple.
Except the quad is made of two triangles. And that diagonal seam between them is where the trouble starts.
 v2 -------- v3
  |  \   T2  |
  | T1  \    |
  |       \  |
 v0 -------- v1
For LINEAR filtering, this is fine – the interpolation across the seam is smooth enough that nobody notices. But for NEAREST filtering, a texel is selected based on which texel center is closest to the interpolated texture coordinate. At the diagonal seam, the two triangles can produce slightly different texture coordinates for pixels that sit right on the boundary. Different coordinates mean different nearest-texel selection, and that means an inconsistent stripe of wrong texels running diagonally across the blit.
The dEQP nearest_consistency tests specifically check for this: they blit with NEAREST filtering and verify that every pixel picks the same texel regardless of which triangle it fell into.

This isn’t a new problem. V3D already has a workaround in u_blitter: it sets use_index_buffer to reorder the triangle indices so that the shared edge of the two triangles is along a different diagonal. This changes which pixels land on the seam and can be enough to pass the tests on some hardware.
On GC7000, that wasn’t sufficient. The floating-point interpolation differences are large enough that the seam remains visible regardless of which diagonal you pick.
Looking at command stream traces from the proprietary Vivante driver, the answer was clear: they don’t draw a quad at all. They draw a single oversized triangle and let the scissor clip it to the destination rectangle.
No seam, no problem.
The idea is simple: take a rectangle and find a single triangle that fully covers it. The smallest such triangle is a right triangle with legs twice the width and twice the height of the rectangle:
 v2
  |\
  |  \
  | rect\
  |------+\
  |      |  \
 v0 -----|--- v1
Vertex 0 stays at the rectangle’s top-left corner. Vertex 1 extends to twice the rectangle width. Vertex 2 extends to twice the rectangle height. The original rectangle is fully contained within this triangle.
The math for transforming the blitter’s 4-vertex quad into a 3-vertex triangle is:
for (unsigned a = 0; a < 2; a++) {      /* pos and texcoord */
   for (unsigned c = 0; c < 4; c++) {   /* xyzw components */
      float v0 = ctx->vertices[0][a][c];
      ctx->vertices[1][a][c] = 2.0f * ctx->vertices[1][a][c] - v0;
      ctx->vertices[2][a][c] = 2.0f * ctx->vertices[3][a][c] - v0;
   }
}
This transforms both position and texture coordinates consistently, so the texture mapping across the visible (scissored) region is identical to what the full quad would have produced – minus the seam.
The oversized triangle extends beyond the destination rectangle, so we need scissor to clip it. The blitter doesn’t always have a scissor set up, so when use_single_triangle is enabled, we synthesize one from the destination box:
if (ctx->base.use_single_triangle && !scissor) {
   synth_scissor.minx = MAX2(dstbox->x, 0);
   synth_scissor.miny = MAX2(dstbox->y, 0);
   synth_scissor.maxx = dstbox->x + dstbox->width;
   synth_scissor.maxy = dstbox->y + dstbox->height;
   scissor = &synth_scissor;
}
The single-triangle transform should only apply to blit operations, not to clears or other blitter draws. A transient single_triangle_active flag is set around the actual blit draw calls and checked in the vertex emission code. Drivers opt in by setting use_single_triangle on the blitter context at creation time.
For etnaviv, that’s a single line:
ctx->blitter->use_single_triangle = true;
The implementation is split into two commits: the u_blitter.c infrastructure (vertex transform, synthesized scissor, gating flag, 3-vertex draw path) that any driver can opt into, and the one-line etnaviv enablement. Keeping them separate means another driver hitting the same seam can flip the flag without touching u_blitter code.
The work landed upstream in u_blitter: Add single-triangle draw mode for NEAREST blit consistency.
Sometimes the fix for a rendering artifact isn’t better math or tighter tolerances – it’s removing the geometric feature that causes the problem in the first place. Two triangles have a seam. One triangle doesn’t.
For almost two decades, the PackageKit package management abstraction layer has shipped with pkcon as its command-line client. pkcon does its job, but it was always kind of a “testing” front-end for the PackageKit daemon rather than a tool designed for everyday use. The focus has instead been on the GUI tools, automatic system updates, GUI application managers and other front-ends. Its command names mirror the D-Bus API almost one-to-one (get-details, get-updates, get-depends), output is very plain, and there is no machine-readable mode for scripting. Most importantly though, there has been no development on it at all for almost a decade, so pkcon was stuck in its rudimentary state from that era.
Since a lot of changes will be coming to PackageKit, and testing the daemon and working with it from the command-line was not very pleasant anymore in 2025/2026, I decided to modernize the tool as part of my work as fellow for the Sovereign Tech Agency last year. pkgcli is the new command-line client for PackageKit. It is built from the ground up to be pleasant to use interactively and easy to drive from scripts.
Of course, instead of introducing a new tool, I could have just expanded pkcon instead. The problem with that approach is that the pkcon utility has been around for so long and its command-line API had ossified so much, that rather than changing it and potentially breaking a lot of scripts relying on its quirks, I decided to introduce a new tool instead. pkcon can still be optionally compiled for people who need it in their scripts and workflows.
The goals for pkgcli, and the features it now has are:
show, search, list-updates, what-provides, instead of get-details and friends.NO_COLOR and degrading gracefully).--json flag emits JSONL instead of fully human-readable output when possible, to make it easier to use the tool for scripting purposes.pkgctl?Originally, this tool was called pkgctl, to match other common cross-distro tool names. However, that name was already taken by an Arch-specific distro development tool. When this issue was raised, we decided to just rename our tool to pkgcli with the next release, to avoid the name clash on Arch Linux.
Here are some examples on how to use the new tool (some of which include the abridged output pkgcli prints).
Search for anything containing the string “editor” in name or description, then look at the details of one result:
$ pkgcli search editor
Querying                  [████████████████████████████████████████] 100%
▣ ace-of-penguins 1.5~rc2-7.amd64 [debian-testing-main]
▣ acorn-fdisk 3.0.6-14.amd64 [debian-testing-main]
▣ ardour 1:9.2.0+ds-1.amd64 [debian-testing-main]
✔ audacity 3.7.7+dfsg-1.amd64 [manual:debian-testing-main]
✔ audacity-data 3.7.7+dfsg-1.all [auto:debian-testing-main]
▣ augeas-tools 1.14.1-1.1.amd64 [debian-testing-main]
▣ emacs 1:30.2+1-3.all [debian-testing-main]
▣ gedit 48.1-9+b1.amd64 [debian-testing-main]
▣ gedit-common 48.1-9.all [debian-testing-main]
▣ gedit-dev 48.1-9+b1.amd64 [debian-testing-main]
[...]

$ pkgcli show nano
Package: nano
Version: 9.0-1
Summary: small, friendly text editor inspired by Pico
Description: GNU nano is an easy-to-use text editor originally designed as
 a replacement for Pico, the ncurses-based editor from the non-free mailer
 package Pine.
[...]
URL: https://www.nano-editor.org/
Group: publishing
Installed Size: 2.9 MB
Download Size: 646.0 KB
Search only within package names rather than descriptions:
$ pkgcli search name python3Check for updates. refresh updates the metadata, then list-updates reports what’s available:
$ pkgcli refresh && pkgcli list-updates
Loading cache            [████████████████████████████████████████] 100%
▲ cme 1.048-1.all [debian-testing-main]
▲ gir1.2-gdm-1.0 50.1-2.amd64 [debian-testing-main]
▲ imagemagick 8:7.1.2.24+dfsg1-1.amd64 [debian-testing-main]
▲ imagemagick-7-common 8:7.1.2.24+dfsg1-1.all [debian-testing-main]
▲ imagemagick-7.q16 8:7.1.2.24+dfsg1-1.amd64 [debian-testing-main]
▲ libdlrestrictions1 0.22.0.amd64 [debian-testing-main]
▲ libfftw3-bin 3.3.11-1.amd64 [debian-testing-main]
▲ libfftw3-dev 3.3.11-1.amd64 [debian-testing-main]
Explore relationships between packages:
$ pkgcli list-depends inkscape  # list what inkscape depends on
$ pkgcli list-requiring libappstream5  # list what requires libappstream5
Find the package that provides a capability, here the AV1 GStreamer decoder:
$ pkgcli what-provides "gstreamer1(decoder-video/x-av1)"
✔ gstreamer1.0-plugins-bad 1.28.3-1.amd64 [auto:debian-testing-main]
You can also have JSON output for most commands! Attach --json to any query and pipe the result straight into jq. Each line is a self-contained JSON object:
$ pkgcli --json list-updates | jq -r '.name'
cme
gir1.2-gdm-1.0
imagemagick
imagemagick-7-common
imagemagick-7.q16
libdlrestrictions1
libfftw3-bin
libfftw3-dev
libfftw3-double3pkgcli is built by default alongside the rest of PackageKit since PackageKit 1.3.4. If your distribution ships a recent enough PackageKit, it should already be on your PATH. You can read its man page man pkgcli for more information. Feedback, bug reports, and patches are very welcome.
If you’ve ever looked at a GPU render and seen blue where red should be, you’ve met the R/B swap problem. For etnaviv this has been a long-standing source of complexity. We were solving it in the shader, but the proprietary blob driver had a simpler approach all along. As part of my work at Igalia, I finally sat down and did it properly.
Vivante GPUs have a quirk: the Pixel Engine (PE) always writes pixels in BGRA byte order. When your API says “render to R8G8B8A8_UNORM”, what actually lands in memory is B, G, R, A. Every byte of every pixel, every frame. The hardware just works that way.
The question is: where do you fix it?
The etnaviv driver was doing it in the shader. Before the fragment shader writes its output, a NIR lowering pass swaps the R and B channels:
   alu->src[0].swizzle[0] = 2;   /* .r reads from .b */
   alu->src[0].swizzle[2] = 0;   /* .b reads from .r */
This works, until it doesn’t. The shader key needs a frag_rb_swap bitmask per render target. The blend color needs per-RT R/B swapping to match. And it falls apart entirely for scalar outputs - if a shader writes a single float, there’s no .z component to swizzle into .x. That’s exactly the NIR validation failure we hit:
Test case 'dEQP-GLES3.functional.fragment_out.basic.fixed.rgb8_lowp_float'..
NIR validation failed after etna_lower_io in ../mesa/src/gallium/drivers/etnaviv/etnaviv_compiler_nir.c:1296
1 errors:
shader: MESA_SHADER_FRAGMENT
source_blake3: {0x4d463d73, 0x4b27d742, 0x27a92b64, 0x375c010f, 0xb2ce3767, 0x2adc55cc, 0x6da8105b, 0x5b9fce29}
name: GLSL1
prev_stage: MESA_SHADER_VERTEX
inputs_read: 32
outputs_written: 4
perspective_varyings: 32
max_subgroup_size: 128
min_subgroup_size: 1
api_subgroup_size_draw_uniform: true
first_ubo_is_default_ubo: true
known_interpolation_qualifiers: true
flrp_lowered: true
inputs: 1
outputs: 1
decl_var shader_in INTERP_MODE_SMOOTH none highp float packed:var0 (VARYING_SLOT_VAR0.x, 0, 0)
decl_var shader_out INTERP_MODE_NONE none mediump float out0 (FRAG_RESULT_DATA0.x, 0, 0)
decl_function main () (entrypoint)

impl main {
    block b0:  // preds:
    32    %3 = load_const (0x00000000)
    32    %4 = @load_input (%3 (0x0)) (base=0, range=1, component=0, dest_type=float32, io location=VARYING_SLOT_VAR0 slots=1)  // packed:var0
    32    %2 = deref_var &out0 (shader_out mediump float)
    32    %5 = mov %4.z
error: src->swizzle[i] < num_components (../mesa/src/compiler/nir/nir_validate.c:217)

               @store_deref (%2, %5) (wrmask=x, access=none)
               // succs: b1
    block b1:
}

FATAL ERROR: Test program crashed
Looking at command stream traces from the proprietary driver, the answer is almost disappointingly simple. Instead of this:
  Texture format: A8B8G8R8     (read BGRA as BGRA)
  PE format:      A8B8G8R8     (write BGRA)
  Shader:         swap R <-> B
The blob does this:
  Texture format: A8R8G8B8     (read BGRA as RGBA - hardware swaps on read)
  PE format:      A8B8G8R8     (write BGRA - unchanged)
  Shader:         nothing
That’s it. Tell the texture sampler the data is A8R8G8B8, and it will correctly interpret the BGRA bytes as RGBA channels. The PE keeps writing BGRA because that’s what it does. No shader modification needed.
In our format table, the change is a single field:
  -  VT(R8G8B8A8_UNORM, UNSIGNED_BYTE, A8B8G8R8, A8B8G8R8)
  +  VT(R8G8B8A8_UNORM, UNSIGNED_BYTE, A8R8G8B8, A8B8G8R8)
                                        ^^^^^^^^
                                     texture format
To understand why this works, trace a red pixel through the pipeline:
                          BGRA-internal byte order
                         +------------------------+
                         |                        |
  API: glClear(1,0,0,1)  |   Memory: [0,0,255,255]|   CPU: expects [255,0,0,255]
  "red = 1.0"            |   (B=0, G=0, R=255,    |   "RGBA order"
                         |    A=255)              |
                         +------------------------+

  +-----------+     +--------+     +--------+     +---------+
  | Shader    |     | PE     |     | Memory |     | Sampler |
  | out=RGBA  | --> | writes | --> | stores | --> | reads   |
  | (1,0,0,1) |     | BGRA   |     | BGRA   |     | as      |
  |           |     |        |     | bytes  |     | A8R8G8B8|
  +-----------+     +--------+     +--------+     +---------+
       |                |               |              |
    R=1.0            B=0x00          [00 00 FF FF]   R=1.0
    G=0.0            G=0x00                          G=0.0
    B=0.0            R=0xFF                          B=0.0
    A=1.0            A=0xFF                          A=1.0
The shader writes (1,0,0,1). The PE swaps R/B on write, so memory gets [0,0,255,255] in BGRA order. The sampler, told the format is A8R8G8B8, reads those same bytes back as (1,0,0,1). Round-trip complete, no shader involvement.
GPU-to-GPU is clean. But what happens at the CPU boundary - glReadPixels, glTexSubImage, glBlitFramebuffer to a CPU-mapped buffer? The CPU expects RGBA byte order. Memory has BGRA. Something needs to swap.
This is where the hardware copy/resolve engines come in - RS and BLT. Both can perform R/B swapping during their copy operations. The RS engine has a swap_rb bit. The BLT engine has per-side swizzle fields. We just need to activate this at the right moment.
The key insight: only transfer blits (tiled-to-linear copies for CPU access) need the swap. GPU-internal blits - glBlitFramebuffer between two render targets, TS resolve, mipmap generation - are all operating on data already in BGRA order on both sides. Swapping there would be wrong.
So we gate it with a context flag:
ctx->in_transfer_blit = true;
etna_copy_resource_box(pctx, trans->rsc, &rsc->base, ...);
ctx->in_transfer_blit = false;
And in the RS blit path:
.swap_rb = ctx->in_transfer_blit &&
           translate_pe_format_rb_swap(blit_info->src.format),
With the basic approach working, tests passed on GC7000 (BLT engine). But GC2000 (RS engine) had a regression: fbo-blit showed blue where red should be.
After adding debug prints and tracing the code paths, the culprit was the texture shadow. Some resources can’t be sampled directly by the texture unit - for example, a render target might use a layout the sampler doesn’t understand. For these, the driver allocates a second copy of the resource in a sampler-compatible tiled layout. This is the “texture shadow”.
The shadow is a workaround that hurts performance - it means extra memory and extra copies. Ideally we wouldn’t need it at all. But while it exists, the driver uses it as a shortcut for CPU transfers: read directly from the shadow and detile in software, skipping the blit engine:
Passing probes:  PATH=temp_resource+RS_blit    swap_rb=1   -> correct
Failing probes:  PATH=texture_shadow                       -> R/B swapped
The texture shadow path does a software detile - raw byte copy, no R/B swap. With BGRA-internal byte order, that gives you BGRA bytes on the CPU side. Wrong.
The fix: skip the texture shadow shortcut for formats that need R/B swap, forcing through the blit engine path which handles the conversion:
if (rsc->texture && !etna_resource_newer(rsc, etna_resource(rsc->texture)) &&
    !translate_pe_format_rb_swap(prsc->format)) {
   /* Use texture shadow - safe, no R/B swap needed */
   rsc = etna_resource(rsc->texture);
} else {
   /* Use blit engine - handles R/B swap correctly */
   ...
}
This is a net-negative patch series - 15 files changed, 76 insertions, 113 deletions. The etnaviv: Remove RB swap logic in the fragment shader contains all that’s needed:
Fixes the NIR validation failure with scalar fragment outputs. And as a nice side effect, removing the shader-based swap means fewer shader variants, fewer instructions and less overhead. glmark2-es2-wayland improves from ~835 to ~874 FPS - a 4.7% performance increase.
Sometimes matching what the hardware vendor does is the right answer. The blob driver figured this out years ago. We just needed to look at the traces.
The texture-format trick has a hidden assumption baked into it: that the GPU both writes and reads every resource. The PE writes BGRA, the sampler is told the format is A8R8G8B8, and the byte order cancels out. It’s a closed loop, and as long as the data never leaves the GPU, nobody outside ever sees the BGRA bytes.
dmabuf breaks the loop.
When a buffer is shared with another process - a Wayland compositor, a video decoder, a camera - the byte order is no longer our private business. It’s mandated by the DRM FourCC. An external producer writes honest RGBA bytes into the buffer. Then our sampler, still convinced the format is A8R8G8B8, reads them as BGRA. Red and blue swap. And on the way out, a transfer blit happily swaps data that was already correct. The optimization that made GPU-internal rendering clean made buffer sharing wrong.
  GPU-internal (closed loop):       dmabuf (loop broken):

  PE writes BGRA                    external producer writes RGBA
       |                                  |
  sampler reads as A8R8G8B8         sampler reads as A8R8G8B8
       |                                  |
  cancels out -> correct            reads RGBA as BGRA -> swapped
The first fix is the obvious one: when a resource is shared, don’t play the trick. Use the native A8B8G8R8 texture format so the sampler reads RGBA bytes as RGBA, skip the R/B swizzle in the BLT and RS transfer blits, and re-enable the texture shadow shortcut that the swizzle had forced us to disable. Internal resources keep the BGRA-internal optimization untouched.
That handles imports. But there’s a case it doesn’t cover: a resource we rendered into and then export. The PE wrote BGRA, because that’s all the PE knows how to do. The external consumer expects native order.
Here a second kind of shadow shows up. Just as the sampler gets a texture shadow when it can’t read the base layout, the PE gets a render shadow - a render-compatible copy - when it can’t draw into the base layout. (On some GPUs, like GC2000, no single tiling satisfies both the texture engine and the pixel engine, so a resource can end up carrying both shadows.) When an exported resource is flushed, that render shadow is resolved back to the base. So we hook etna_flush_resource() and do the R/B swap during that copy - using the BLT destination swizzle or the RS SWAP_RB bit. The swap rides along on a copy we were doing anyway.
Now the same shared buffer can be in one of two states. Just imported, or just flushed for export? Native RGBA. Freshly rendered by the PE, not yet flushed? PE-internal BGRA. A static texture format chosen at sampler-view creation can’t be right for both.
So the format choice becomes dynamic. A shared_native_order flag tracks which order the bytes are currently in, and the sampler-view format follows from it:
shared_native_order |
How you get there | Bytes in buffer | Sampler format |
|---|---|---|---|
true |
set on import, and again after flush_resource() swaps on export |
native RGBA | A8B8G8R8 (native) |
false |
cleared when the PE renders straight into the buffer with no render shadow, and no shader swap fixed up the bytes (see below) | PE-internal BGRA | A8R8G8B8 (the trick) |
Both texture paths - state-based and descriptor-based - pre-compute the native format variant at sampler-view creation, so picking the right one at emit time costs a single branch, not a per-frame format recompute.
Which brings us to LINEAR_PE GPUs, and a twist I didn’t see coming.
On these GPUs, a linear shared resource is render-compatible. There is no render shadow - the PE writes straight into the buffer that gets handed to the compositor. So after a draw, the buffer holds BGRA, and flush_resource() would have to issue a full-surface blit to swap it. That’s real bandwidth, on every frame, that the old shadow-based path never paid.
There’s a cheaper place to do the swap: in the shader, on the way out. Which is exactly the thing this whole series set out to delete.
So it comes back - but only for this one case, and done properly. A per-RT frag_rb_swap bitmask in the shader key drives a NIR lowering pass that swaps channels 0 and 2 on the fragment output. The original shader swap fell over on scalar outputs, because there was no .z to swizzle from. This one widens the output variable to vec4 first, padding the missing components with undef, then applies the swizzle with an adjusted writemask:
   /* Pad source to 4 components (undef for missing) */
   nir_def *padded = nir_pad_vec4(&b, src);

   /* Swap R and B channels */
   unsigned swiz[] = {2, 1, 0, 3};
That’s the scalar rgb8_lowp_float crash from the top of this post - fixed, in the one path that now needs a shader swap at all.
Wiring it up is a check in etna_draw_vbo():
   if (VIV_FEATURE(screen, ETNA_FEATURE_LINEAR_PE)) {
      for (i = 0; i < pfb->nr_cbufs; i++) {
         struct etna_resource *rsc = etna_resource(pfb->cbufs[i].texture);
         if (rsc->shared && rsc->layout == ETNA_LAYOUT_LINEAR &&
             translate_pe_format_rb_swap(pfb->cbufs[i].format))
            key.frag_rb_swap |= (1 << i);
      }
   }
The bitmask is per-RT, so an MRT setup with a mix of shared and private targets does the right thing for each. And because the shader produced native bytes directly, shared_native_order stays true and flush_resource() skips its blit entirely.
The fixes for all of this live in a follow-up series, etnaviv: Fix dmabuf R/B byte order for PE_FORMAT_RB_SWAP formats.
No - but it wasn’t the whole answer either.
The shader swap was wrong as the universal solution. It cost a shader-key dimension, per-RT blend-color fixups, and it crashed on scalar outputs. The texture-format trick is genuinely better for the common case, where a resource lives and dies on the GPU.
What the dmabuf work showed is that there is no single right place to fix R/B order. There’s a place that’s cheapest for each path: the texture format for GPU-internal resources, a transfer-blit swap at the CPU boundary, a flush-time swap for exported render targets, and - for LINEAR_PE, where the PE writes straight into a shared buffer - the shader, after all. The trick isn’t picking one. It’s knowing which boundary you’re standing on, and swapping there.
As part of Igalia’s collaboration with Raspberry Pi, I have previously blogged about several improvements we landed for the Broadcom VideoCore GPU (known as V3D), with the goal of extracting the best possible performance from the hardware. However, performance is not the whole story. On embedded devices, power consumption is just as important: reducing unnecessary activity helps lower heat generation, improve energy efficiency, and preserve performance over time by avoiding thermal throttling.
That is why, over the last few months, we have been working on adding Runtime Power Management support to the upstream V3D DRM driver, allowing the GPU to be powered and clocked according to its actual usage.
In the Linux kernel, Runtime Power Management (known as Runtime PM) is the mechanism that allows individual devices to be suspended and resumed dynamically while the system as a whole remains running. Instead of keeping a device fully powered all the time, the kernel can put the device into a low-power state when it is idle and bring it back when it is needed again.
In the graphics context, it is easy to see why runtime PM can be useful. A GPU is not necessarily active all the time: it may be heavily used while rendering a scene, but remain idle for long periods afterwards. If the driver keeps the GPU clocked during those idle periods, the system keeps spending energy on a block that is not doing useful work at all.
For embedded platforms, this is even more pressing. Reducing unnecessary power consumption helps decrease heat generation and improve overall energy efficiency. Even if the board is not battery-powered, avoiding needless power usage can reduce the need for cooling and leave more thermal budget available for other blocks.
Until now, the V3D driver had a very simple power model: the GPU clock was enabled during probe and remained enabled for the entire lifetime of the driver. In practice, this meant that once the driver was loaded, the V3D clock stayed on until the driver was removed, regardless of whether the GPU was actively executing jobs. This was simple and functional, but it meant that an idle GPU was not idle from a power-management point of view.
On Raspberry Pi platforms, this is easy to observe with vcgencmd. Even with no GPU workload running, the V3D clock would still report an enabled frequency:
$ vcgencmd measure_clock v3d
frequency(0)=960016128
If the GPU is idle, the driver should be able to let the hardware become idle as well. Runtime PM provides the kernel infrastructure for that, but enabling it in the V3D driver required a bit more than simply adding suspend and resume callbacks.
At first glance, adding Runtime PM to V3D might look like a driver-local change, but in practice, things were a bit more subtle.
On Raspberry Pi platforms, some clocks are managed by the Raspberry Pi firmware. From the V3D driver’s point of view, this is supposed to be mostly transparent: the driver uses the standard Linux clock framework, and the clock provider takes care of talking to the firmware underneath. However, this abstraction only works if calls to clk_prepare_enable() and clk_disable_unprepare() are translated into actual firmware requests to enable and disable the clock.
Surprisingly, that was not happening. The Raspberry Pi firmware clock driver did not implement the prepare/unprepare hooks, so these calls did not actually ask the firmware to enable or disable the clock. We fixed that by translating the common clock framework operations into the corresponding Raspberry Pi firmware commands [1][2][3].
However, there was still one firmware-specific caveat: on current firmware versions, RPI_FIRMWARE_SET_CLOCK_STATE does not fully power off the clock as expected. To work around this limitation and achieve meaningful power savings, the clock rate also needs to be set to the minimum before disabling the clock. This behavior may change in future firmware releases, but for now the clock driver needs to account for it explicitly.
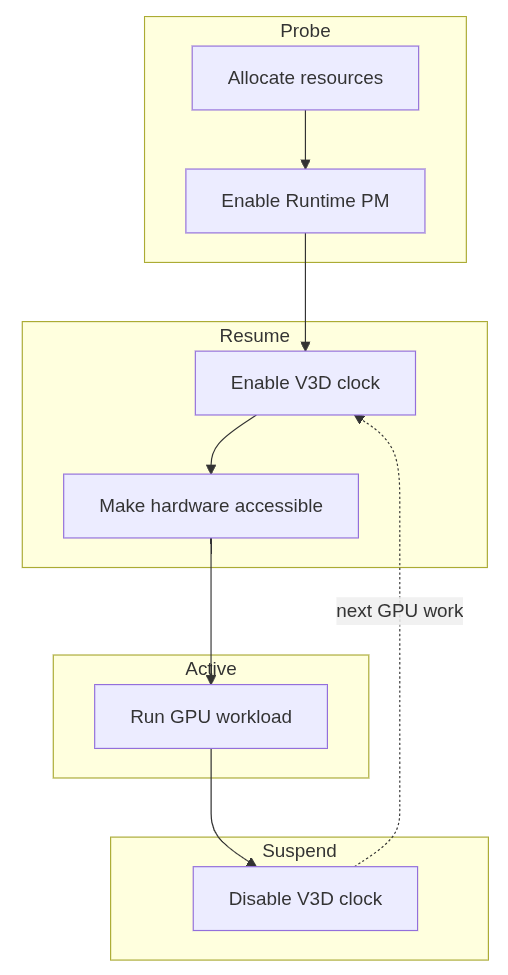
With the firmware clock limitation addressed, the V3D driver could start relying on the usual kernel clock APIs as part of its Runtime PM flow. The next step was to reorganize the driver so that powering the GPU up and down became part of its operation.
With the clock side behaving as expected, we could move the V3D driver itself to a Runtime PM model [7][8][9].
This required a small refactor of the probe path to separate power-independent setup from GPU-powered initialization. Resources that do not require the GPU to be powered are allocated during probe, while any initialization that depends on the GPU being clocked is handled during runtime resume. Runtime suspend then disables the clock again when the device becomes idle. The resulting flow is simple:
With that in place, the change becomes visible from userspace. While a GPU workload such as glmark2 is running, the V3D clock is enabled:
$ vcgencmd measure_clock v3d
frequency(0)=960016128
After the workload finishes and the GPU becomes idle, the clock can drop back to zero:
$ vcgencmd measure_clock v3d
frequency(0)=0
This is the behavior we wanted: the GPU remains available when there is work to do, but it no longer keeps its clock enabled while idle.
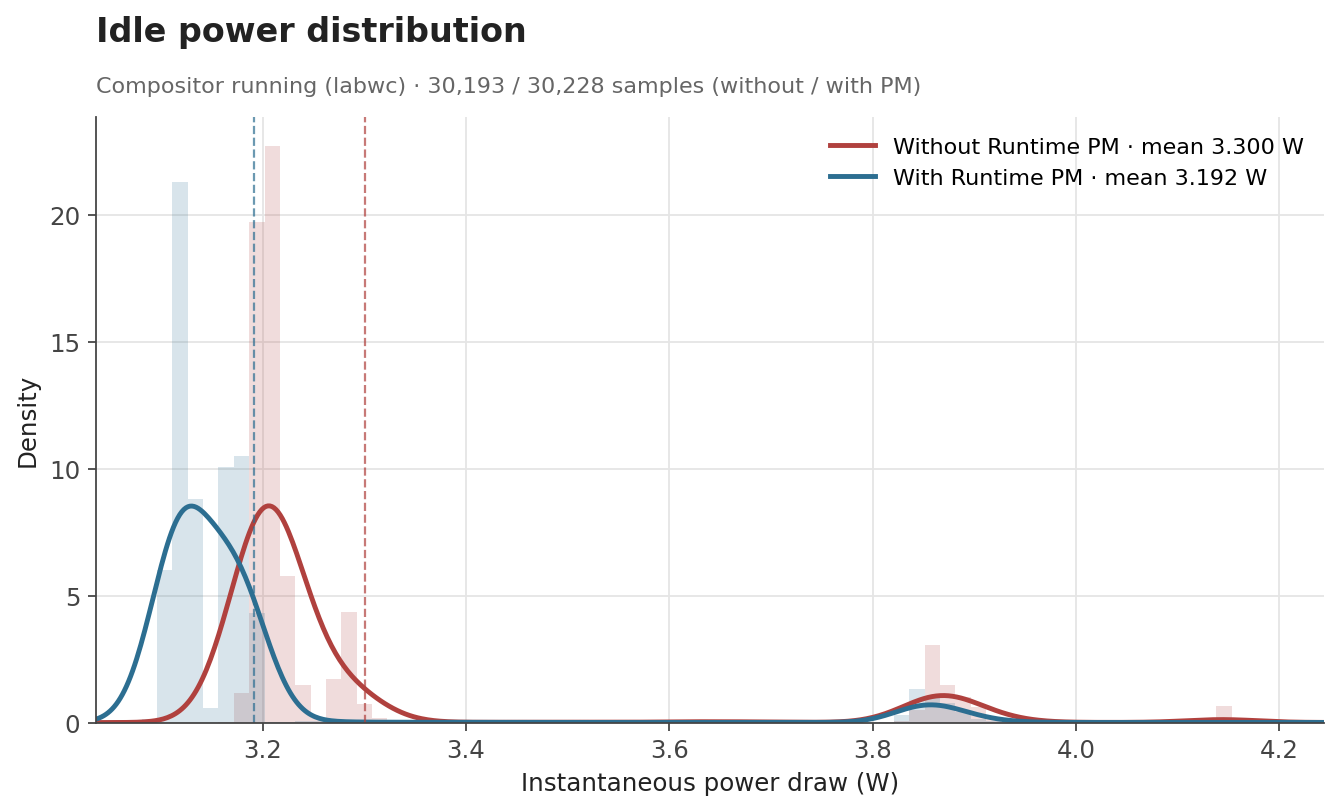
To evaluate the effect of Runtime PM, we measured the board’s power consumption with an external power meter in three scenarios: an idle desktop session with labwc running, an idle system without the compositor, and a full glmark2 run. Each condition was sampled at 100 Hz for around 300 seconds.
The first case represents a mostly idle graphical session, where labwc, the compositor used by Raspberry Pi OS, may still wake the GPU occasionally. The second is a baseline with no graphical workload, while the third is a sustained GPU benchmark intended to keep the GPU active.
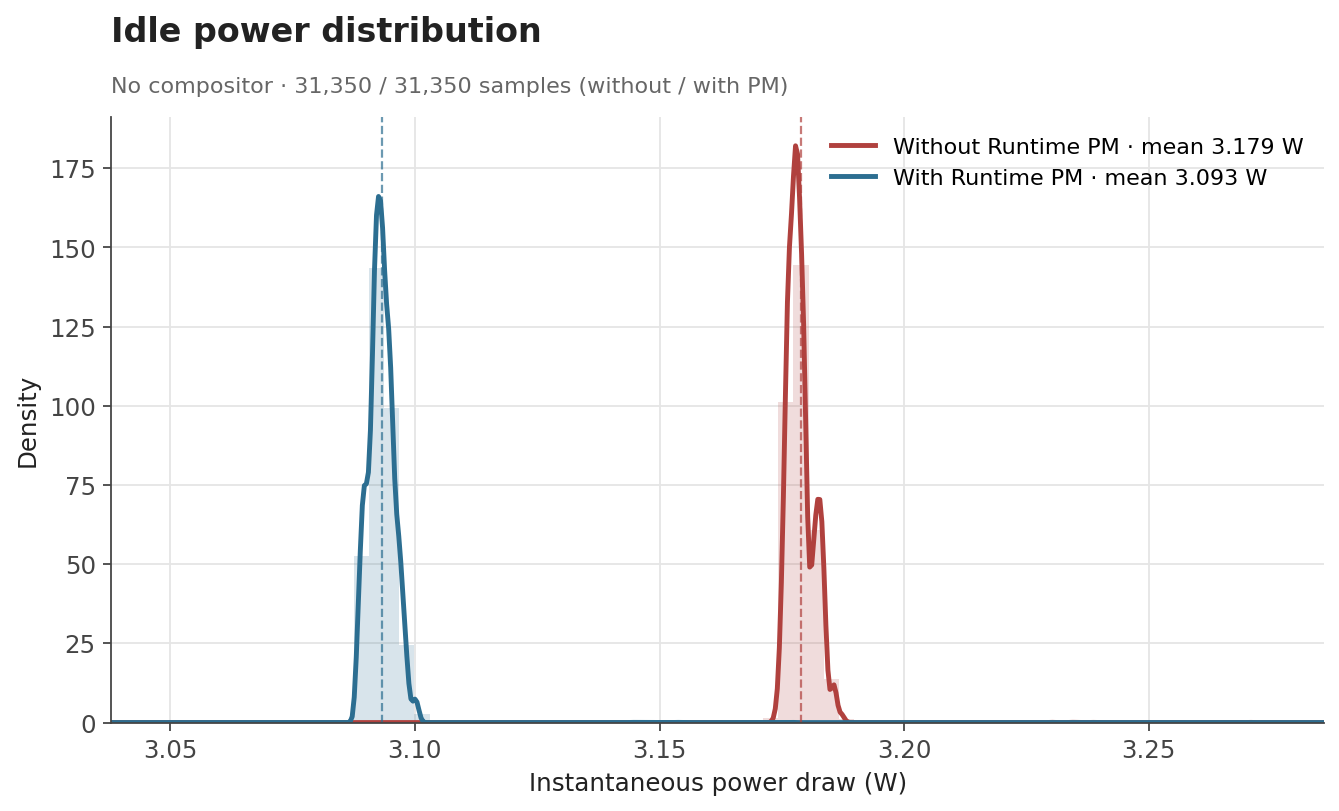
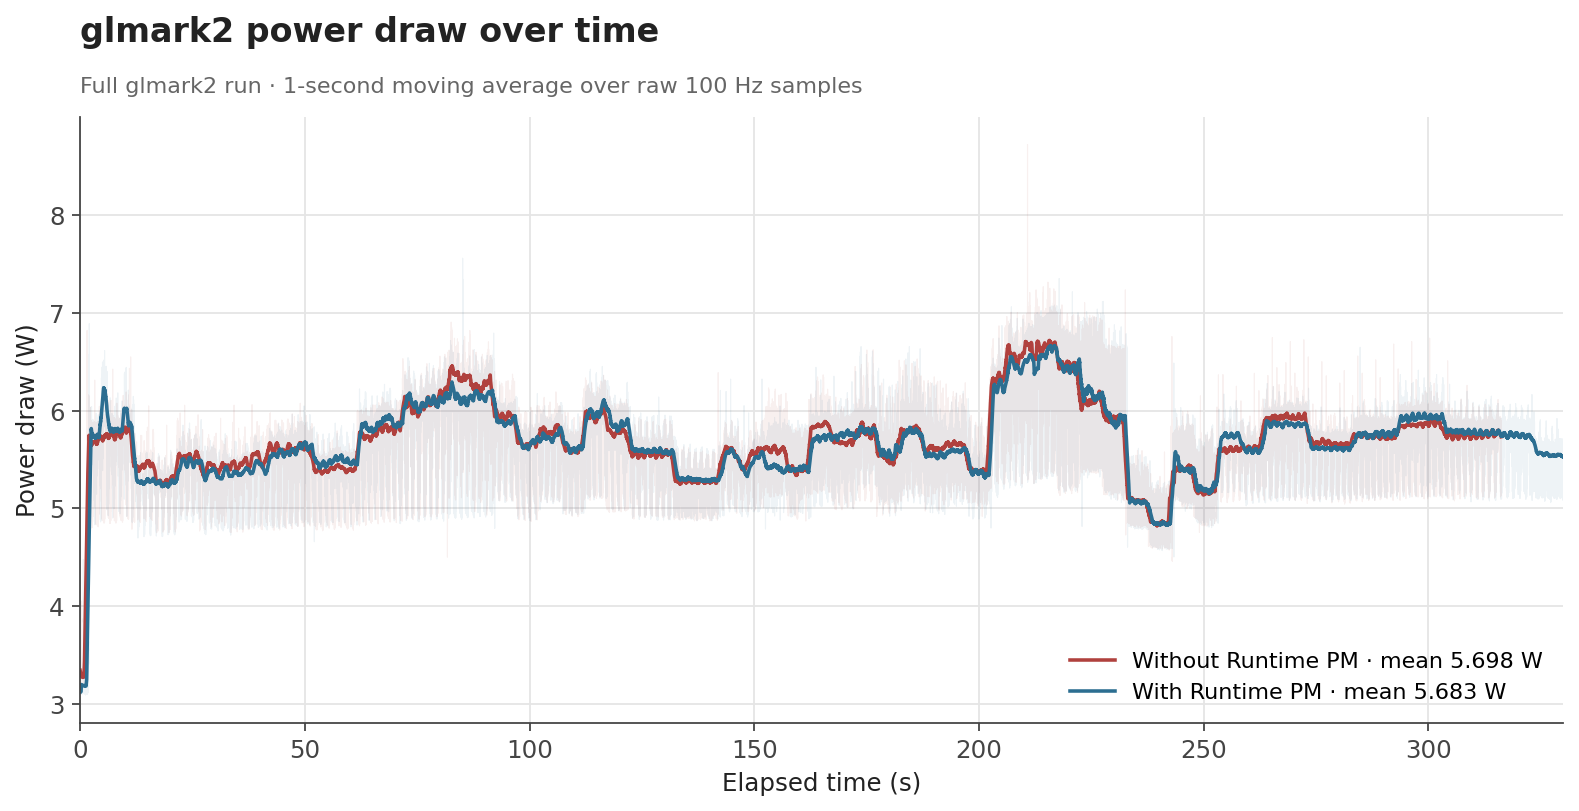
The numbers behave the way one would hope. When the GPU is genuinely idle, the clock can be gated off and the savings show up as a clear drop: average draw falls from 3.30 W to 3.19 W with labwc running, and from 3.18 W to 3.09 W with no compositor at all. Both idle scenarios end up with savings of about 0.1 W (around 3%). Under glmark2, where the GPU is doing useful work for most of the run, the difference shrinks to about 0.015 W (0.3%), which is expected, as Runtime PM mainly affects the periods where the GPU becomes idle.
| Scenario | Before | After | Difference |
|---|---|---|---|
| Idle, compositor running | 3.300 W | 3.192 W | -0.108 W (-3.3%) |
| Idle, no compositor | 3.179 W | 3.093 W | -0.086 W (-2.7%) |
glmark2 full run |
5.698 W | 5.683 W | -0.015 W (-0.3%) |
The distribution of idle samples with labwc running also shows the effect clearly. With Runtime PM enabled, the distribution shifts toward lower power states. This indicates that the board spends more time in lower-power idle states once the V3D clock is no longer kept enabled unnecessarily.
The effect is even cleaner with no compositor running. The samples collapse into two very narrow peaks with no overlap between them: without Runtime PM, the board sits at a stable 3.18 W; with Runtime PM, it sits at a stable 3.09 W.
For glmark2, the time-series data shows that both configurations follow the same general workload pattern. Runtime PM does not significantly change the power profile while the GPU is busy, which is the intended behavior. The benefit appears when the workload leaves idle gaps or finishes, allowing the clock to be disabled again.
Overall, these measurements show that Runtime PM reduces power consumption where it matters most: when the GPU is idle. The absolute savings are modest at the board level, since the measurement includes the whole Raspberry Pi rather than the GPU power block alone, but the reduction is consistent with the intended change. The V3D clock no longer remains enabled for the full lifetime of the driver, and that translates into measurable reductions in idle power consumption.
Runtime PM support for V3D is one of those changes that is easy to overlook when everything is working correctly: userspace does not need to do anything differently, applications keep using the GPU as before, and the improvement happens underneath, in the way the kernel manages the hardware.
Beyond improving raw GPU performance, our work at Igalia is also about making the upstream graphics stack behave better as a system: more efficient when idle, more robust across firmware interfaces, and better aligned with the expectations of the Linux kernel infrastructure.
[2] clk: bcm: rpi: Maximize V3D clock - kernel/git/torvalds/linux.git - Linux kernel source tree
Software Engineering Radio is a podcast for people in IT/development with over 700 episodes across many topics over 20 years. They haven't touched on the Linux kernel much. I was invited on as part of my role at Red Hat as a Distinguished Engineer, but the podcast is really an insight into kernel maintenance, in graphics and beyond, touching on the scope and scale of the project.
It was my first time to record something that wasn't just me talking at a conference/meetup, and it was all very professional, with sound checks and brainstorming before hand.
The content is at a pretty broad and introductory level. We talked about kernel development processes, maintenance processes, and we touch on rust in the kernel a bit. It's mostly about the sheer size and scale of the project and how Linus releases things, how trees get to Linus and how the GPU work is done.
Hopefully you enjoy listening to it!
[1] https://se-radio.net/2026/06/se-radio-723-dave-airlie-on-linux-kernel-maintenance/
Back when we started with a signed shim in Debian, the tooling was Windows-only and required me to do a reboot dance and it was all quite tedious. Over time, more and more of the tooling has migrated to Linux and it all works quite well.
The signing is done with an EV code signing cert from SSL.com and stored on a Yubikey. Getting the certificate onto the key is a bit tedious, but reasonably well-explained in the ssl.com docs.
Microsoft wants the shim binaries uploaded to their partner portal
wrapped in a .cab file, which should be signed.
The wrapping in a .cab file is easy enough: lcab shim.efi shim-unsigned.cab. It’s fine to put shims for multiple architectures
in the same .cab file.
Signing of the file is a little bit of a rune:
osslsigncode sign -pkcs11module /usr/lib/x86_64-linux-gnu/libykcs11.so -key "pkcs11:serial=XXX" -askpass -certs chain.crt -h sha256 -ts http://ts.ssl.com shim-unsigned.cab shim-unsigned.signed.cab
chain.crt contains first our EV code signing cert, then the ssl.com
intermediate EV code signing cert, then the ssl.com EV root cert. The
naming of the packages is a tiny bit confusing, but it’s because the
package name in Debian is shim-unsigned.
Occasionally, processing of uploaded binaries just stops in the validation stage in the portal, but I’ve so far been able to unstuck them by re-signing and uploading again, and I saw the same with the MS/Windows toolchain, so I suspect it’s just flakiness on the portal side.
It’s a question I had to ask myself multiple times over the last few months. Depending on the context the answer can be:
If you are an app developer, you’re lucky and it’s almost always the first answer. If you develop something with a security boundary which involves files in any way, the correct answer is very likely the second one.
Like so often, the details depend on the specifics, but in the worst-case scenario, there is a process on either side of the security boundary, which operate on a filesystem tree which is shared by both processes.
Let’s say that the process with more privileges operates on a file on behalf of the process with less privileges. You might want to restrict this to files in a certain directory, to prevent the less privileged process from, for example, stealing your SSH key, and thus take a subpath that is relative to that directory.
The first obvious problem is that the subpath can refer to files outside of the directory if it contains ... If the privileged process gets called with a subpath of ../.ssh/id_ed25519, you are in trouble. Easy fix: normalize the path, and if we ever go outside of the directory, fail.
The next issue is that every component of the path might be a symlink. If the privileged process gets called with a subpath of link, and link is a symlink to ../.ssh/id_ed25519, you might be in trouble. If the process with less privileges cannot create files in that part of the tree, it cannot create a malicious symlink, and everything is fine. In all other scenarios, nothing is fine. Easy fix: resolve the symlinks, expand the path, then normalize it.
This is usually where most people think we’re done, opening a file is not that hard after all, we can all do more fun things now. Really, this is where the fun begins.
The fix above works, as long as the less privileged process cannot change the file system tree anywhere in the file’s path while the more privileged process tries to access it. Usually this is the case if you unpack an attacker-provided archive into a directory the attacker does not have access to. If it can however, we have a classic TOCTOU (time-of-check to time-of-use) race.
We have the path foo/id_ed25519, we resolve the smlinks, we expand the path, we normalize it, and while we did all of that, the other process just replaced the regular directory foo that we just checked with a symlink which points to ../.ssh. We just checked that the path resolves to a path inside the target directory though, and happily open the path foo/id_ed25519 which now points to your ssh key. Not an easy fix.
So, what is the fundamental issue here? A path string like /home/user/.local/share/flatpak/app/org.example.App/deploy describes a location in a filesystem namespace. It is not a reference to a file. By the time you finish speaking the path aloud, the thing it names may have changed.
The safe primitive is the file descriptor. Once you have an fd pointing at an inode, the kernel pins that inode. The directory can be unlinked, renamed, or replaced with a symlink; the fd does not care. A common misconception is that file descriptors represent open files. It is true that they can do that, but fds opened with O_PATH do not require opening the file, but still provide a stable reference to an inode.
The lesson that should be learned here is that you should not call any privileged process with a path. Period. Passing in file descriptors also has the benefit that they serve as proof that the calling process actually has access to the resource.
Another important lesson is that dropping down from a file descriptor to a path makes everything racy again. For example, let’s say that we want to bind mount something based on a file descriptor, and we only have the traditional mount API, so we convert the fd to a path, and pass that to mount. Unfortunately for the user, the kernel resolves the symlinks in the path that an attacker might have managed to place there. Sometimes it’s possible to detect the issue after the fact, for example by checking that the inode and device of the mounted file and the file descriptor match.
With that being said, sometimes it is not entirely avoidable to use paths, so let’s also look into that as well!
In the scenario above, we have a directory in which we want all the paths to resolve in, and that the attacker does not control. We can thus open it with O_PATH and get a file descriptor for it without the attacker being able to redirect it somewhere else.
With the openat syscall, we can open a path relative to the fd we just opened. It has all the same issues we discussed above, except that we can also pass O_NOFOLLOW. With that flag set, if the last segment of the path is a symlink, it does not follow it and instead opens the actual symlink inode. All the other components can still be symlinks, and they still will be followed. We can however just split up the path, and open the next file descriptor for the next path segment and resolve symlinks manually until we have done so for the entire path.
libglnx is a utility library for GNOME C projects that provides fd-based filesystem operations as its primary API. Functions like glnx_openat_rdonly, glnx_file_replace_contents_at, and glnx_tmpfile_link_at all take directory fds and operate relative to them. The library is built around the discipline of “always have an fd, never use an absolute path when you can use an fd.”
The most recent addition is glnx_chaseat, which provides safe path traversal, and was inspired by systemd’s chase(), and does precisely what was described above.
int glnx_chaseat (int              dirfd,
                  const char      *path,
                  GlnxChaseFlags   flags,
                  GError         **error);
It returns an O_PATH | O_CLOEXEC fd for the resolved path, or -1 on error. The real magic is in the flags:
typedef enum _GlnxChaseFlags {
  /* Default */
  GLNX_CHASE_DEFAULT = 0,
  /* Disable triggering of automounts */
  GLNX_CHASE_NO_AUTOMOUNT = 1 << 1,
  /* Do not follow the path's right-most component. When the path's right-most
   * component refers to symlink, return O_PATH fd of the symlink. */
  GLNX_CHASE_NOFOLLOW = 1 << 2,
  /* Do not permit the path resolution to succeed if any component of the
   * resolution is not a descendant of the directory indicated by dirfd. */
  GLNX_CHASE_RESOLVE_BENEATH = 1 << 3,
  /* Symlinks are resolved relative to the given dirfd instead of root. */
  GLNX_CHASE_RESOLVE_IN_ROOT = 1 << 4,
  /* Fail if any symlink is encountered. */
  GLNX_CHASE_RESOLVE_NO_SYMLINKS = 1 << 5,
  /* Fail if the path's right-most component is not a regular file */
  GLNX_CHASE_MUST_BE_REGULAR = 1 << 6,
  /* Fail if the path's right-most component is not a directory */
  GLNX_CHASE_MUST_BE_DIRECTORY = 1 << 7,
  /* Fail if the path's right-most component is not a socket */
  GLNX_CHASE_MUST_BE_SOCKET = 1 << 8,
} GlnxChaseFlags;
While it doesn’t sound too complicated to implement, a lot of details are quite hairy. The implementation uses openat2, open_tree and openat depending on what is available and what behavior was requested, it handles auto-mount behavior, ensures that previously visited paths have not changed, and a few other things.
The POSIX APIs are not great at dealing with the issue. The GLib/Gio APIs (GFile, etc.) are even worse and only accept paths. Granted, they also serve as a cross-platform abstraction where file descriptors are not a universal concept. Unfortunately, Rust also has this cross-platform abstraction which is based entirely on paths.
If you use any of those APIs, you very likely created a vulnerability. The deeper issue is that those path-based APIs are often the standard way to interact with files. This makes it impossible to reason about the security of composed code. You can audit your own code meticulously, open everything with O_PATH | O_NOFOLLOW, chain *at() calls carefully — and then call a third-party library that calls open(path) internally. The security property you established in your code does not compose through that library call.
This means that any system-level code that cares about filesystem security has to audit all transitive dependencies or avoid them in the first place.
So what would a better GLib cross-platform API look like? I would say not too different from chaseat(), but returning opaque handles instead of file descriptors, which on Unix would carry the O_PATH file descriptor and a path that can be used for printing, debugging and things like that. You would open files from those handles, which would yield another kind of opaque handle for reading, writing, and so on.
The current GFile was also designed to implement GVfs: g_file_new_for_uri("smb://server/share/file") gives you a GFile you can g_file_read() just like a local file. This is the right goal, but the wrong abstraction layer. Instead, this kind of access should be provided by FUSE, and the URI should be translated to a path on a specific FUSE mount. This would provide a few benefits:
Nowadays I maintain a small project called Flatpak. Codean Labs recently did a security analysis on it and found a number of issues. Even though Flatpak developers were aware of the dangers of filesystems, and created libglnx because of it, most of the discovered issues were just about that. One of them (CVE-2026-34078) was a complete sandbox escape.
flatpak run was designed as a command-line tool for trusted users. When you type flatpak run org.example.App, you control the arguments. The code that processes the arguments was written assuming the caller is legitimate. It accepted path strings, because that’s what command-line tools accept.
The Flatpak portal was then built as a D-Bus service that sandboxed apps could call to start subsandboxes — and it did this by effectively constructing a flatpak run invocation and executing it. This connected a component designed for trusted input directly to an untrusted caller (the sandboxed app).
Once that connection exists, every assumption baked into flatpak run about caller trustworthiness becomes a potential vulnerability. The fix wasn’t “change one function” — it was “audit the entire call chain from portal request to bubblewrap execution and replace every path string with an fd.” That’s commits touching the portal, flatpak-run, flatpak_run_app, flatpak_run_setup_base_argv, and the bwrap argument construction, plus new options (--app-fd, --usr-fd, --bind-fd, --ro-bind-fd) threaded through all of them.
If the GLib standard file and path APIs were secure, we would not have had this issue.
Another annoyance here is that the entire subsandboxing approach in Flatpak comes from 15 years ago, when unprivileged user namespaces were not common. Nowadays we could (and should) let apps use kernel-native unprivileged user namespaces to create their own subsandboxes.
Unfortunately with rather large changes comes a high likelihood of something going wrong. For a few days we scrambled to fix a few regressions that prevented Steam, WebKit, and Chromium-based apps from launching. Huge thanks to Simon McVittie!
In the end, we managed to fix everything, made Flatpak more secure, the ecosystem is now better equipped to handle this class of issues, and hopefully you learned something as well.
If you have recently installed a very up-to-date Linux distribution with a desktop environment, or upgraded your system on a rolling-release distribution, you might have noticed that your home directory has a new folder: “Projects”
With the recent 0.20 release of xdg-user-dirs we enabled the “Projects” directory by default. Support for this has already existed since 2007, but was never formally enabled. This closes a more than 11 year old bug report that asked for this feature.
The purpose of the Projects directory is to give applications a default location to place project files that do not cleanly belong into one of the existing categories (Documents, Music, Pictures, Videos). Examples of this are software engineering projects, scientific projects, 3D printing projects, CAD design or even things like video editing projects, where project files would end up in the “Projects” directory, with output video being more at home in “Videos”.
By enabling this by default, and subsequently in the coming months adding support to GLib, Flatpak, desktops and applications that want to make use of it, we hope to give applications that do operate in a “project-centric” manner with mixed media a better default storage location. As of now, those tools either default to the home directory, or will clutter the “Documents” folder, both of which is not ideal. It also gives users a default organization structure, hopefully leading to less clutter overall and better storage layouts.

As usual, you are in control and can modify your system’s behavior. If you do not like the “Projects” folder, simply delete it! The xdg-user-dirs utility will not try to create it again, and instead adjust the default location for this directory to your home directory. If you want more control, you can influence exactly what goes where by editing your ~/.config/user-dirs.dirs configuration file.
If you are a system administrator or distribution vendor and want to set default locations for the default XDG directories, you can edit the /etc/xdg/user-dirs.defaults file to set global defaults that affect all users on the system (users can still adjust the settings however they like though).
Besides this change, the 0.20 release of xdg-user-dirs brings full support for the Meson build system (dropping Automake), translation updates, and some robustness improvements to its code. We also fixed the “arbitrary code execution from unsanitized input” bug that the Arch Linux Wiki mentions here for the xdg-user-dirs utility, by replacing the shell script with a C binary.
Thanks to everyone who contributed to this release!
This post attempts to explain how Huion tablet devices currently integrate into the desktop stack. I'll touch a bit on the Huion driver and the OpenTablet driver but primarily this explains the intended integration[1]. While I have access to some Huion devices and have seen reports from others, there are likely devices that are slightly different. Huion's vendor ID is also used by other devices (UCLogic and Gaomon) so this applies to those devices as well.
This post was written without AI support, so any errors are organic artisian hand-crafted ones. Enjoy.
First, a short overview of the ideal graphics tablet stack in current desktops. At the bottom is the physical device which contains a significant amount of firmware. That device provides something resembling the HID protocol over the wire (or bluetooth) to the kernel. The kernel typically handles this via the generic HID drivers [2] and provides us with an /dev/input/event evdev node, ideally one for the pen (and any other tool) and one for the pad (the buttons/rings/wheels/dials on the physical tablet). libinput then interprets the data from these event nodes, passes them on to the compositor which then passes them via Wayland to the client. Here's a simplified illustration of this:

Unlike the X11 api, libinput's API works both per-tablet and per-tool basis. In other words, when you plug in a tablet you get a libinput device that has a tablet tool capability and (optionally) a tablet pad capability. But the tool will only show up once you bring it into proximity. Wacom tools have sufficient identifiers that we can a) know what tool it is and b) get a unique serial number for that particular device. This means you can, if you wanted to, track your physical tool as it is used on multiple devices. No-one [3] does this but it's possible. More interesting is that because of this you can also configure the tools individually, different pressure curves, etc. This was possible with the xf86-input-wacom driver in X but only with some extra configuration, libinput provides/requires this as the default behaviour.
The most prominent case for this is the eraser which is present on virtually all pen-like tools though some will have an eraser at the tail end and others (the numerically vast majority) will have it hardcoded on one of the buttons. Changing to eraser mode will create a new tool (the eraser) and bring it into proximity - that eraser tool is logically separate from the pen tool and can thus be configured differently. [4]
Another effect of this per-tool behaviour is also that we know exactly what a tool can do. If you use two different styli with different capabilities (e.g. one with tilt and 2 buttons, one without tilt and 3 buttons), they will have the right bits set. This requires libwacom - a library that tells us, simply: any tool with id 0x1234 has N buttons and capabilities A, B and C. libwacom is just a bunch of static text files with a C library wrapped around those. Without libwacom, we cannot know what any individual tool can do - the firmware and kernel always expose the capability set of all tools that can be used on any particular tablet. For example: wacom's devices support an airbrush tool so any tablet plugged in will announce the capabilities for an airbrush even though >99% of users will never use an airbrush [5].
The compositor then takes the libinput events, modifies them (e.g. pressure curve handling is done by the compositor) and passes them via the Wayland protocol to the client. That protocol is a pretty close mirror of the libinput API so it works mostly the same. From then on, the rest is up to the application/toolkit.
Notably, libinput is a hardware abstraction layer and conversion of hardware events into others is generally left to the compositor. IOW if you want a button to generate a key event, that's done either in the compositor or in the application/toolkit. But the current versions of libinput and the Wayland protocol do support all hardware features we're currently aware of: the various stylus types (including Wacom's lens cursor and mouse-like "puck" devices) and buttons, rings, wheels/dials, and touchstrips on pads. We even support the rather once-off Dell Canvas Totem device.
Huion's devices are HID compatible which means they "work" out of the box but they come in two different modes, let's call them firmware mode and tablet mode. Each tablet device pretends to be three HID devices on the wire and depending on the mode some of those devices won't send events.
This is the default mode after plugging the device in. Two of the HID devices exposed look like a tablet stylus and a keyboard. The tablet stylus is usually correct (enough) to work OOTB with the generic kernel drivers, it exports the buttons, pressure, tilt, etc. The buttons and strips/wheels/dials on the tablet are configured to send key events. For example, the Inspiroy 2S I have sends b/i/e/Ctrl+S/space/Ctrl+Alt+z for the buttons and the roller wheel sends Ctrl-/Ctrl= depending on direction. The latter are often interpreted as zoom in/out so hooray, things work OOTB. Other Huion devices have similar bindings, there is quite some overlap but not all devices have exactly the same key assignments for each button. It does of course get a lot more interesting when you want a button to do something different - you need to remap the key event (ideally without messing up your key map lest you need to type an 'e' later).
The userspace part is effectively the same, so here's a simplified illustration of what happens in kernel land:

If you read a special USB string descriptor from the English language ID, the device switches into tablet mode. Once in tablet mode, the HID tablet stylus and keyboard devices will stop sending events and instead all events from the device are sent via the third HID device which consists of a single vendor-specific report descriptor (read: 11 bytes of "here be magic"). Those bits represent the various features on the device, including the stylus features and all pad features as buttons/wheels/rings/strips (and not key events!). This mode is the one we want to handle the tablet properly. The kernel's hid-uclogic driver switches into tablet mode for supported devices, in userspace you can use e.g. huion-switcher. The device cannot be switched back to firmware mode but will return to firmware mode once unplugged.
Once we have the device in tablet mode, we can get true tablet data and pass it on through our intended desktop stack. Alas, like ogres there are layers.
Historically and thanks in large parts to the now-discontinued digimend project, the hid-uclogic kernel driver did do the switching into tablet mode, followed by report descriptor mangling (inside the kernel) so that the resulting devices can be handled by the generic HID drivers. The more modern approach we are pushing for is to use udev-hid-bpf which is quite a bit easer to develop for. But both do effectively the same thing: they overlay the vendor-specific data with a normal HID report descriptor so that the incoming data can be handled by the generic HID kernel drivers. This will look like this:

Notable here: the stylus and keyboard may still exist and get event nodes but never send events[6] but the uclogic/bpf-enabled device will be proper stylus/pad event nodes that can be handled by libinput (and thus the rest), with raw hardware data where buttons are buttons.
Because in true manager speak we don't have problems, just challenges. And oh boy, we collect challenges as if we'd be organising the olypmics.
First and probably most embarrassing is that hid-uclogic has a different way of exposing event nodes than what libinput expects. This is largely my fault for having focused on Wacom devices and internalized their behaviour for long years. The hid-uclogic driver exports the wheels and strips on separate event nodes - libinput doesn't handle this correctly (or at all). That'd be fixable but the compositors also don't really expect this so there's a bit more work involved but the immediate effect is that those wheels/strips will likely be ignored and not work correctly. Buttons and pens work.

hid-uclogic being a kernel driver has access to the underlying USB device. The HID-BPF hooks in the kernel currently do not, so we cannot switch the device into tablet mode from a BPF, we need it in tablet mode already. This means a userspace tool (read: huion-switcher) triggered via udev on plug-in and before the udev-hid-bpf udev rules trigger. Not a problem but it's one more moving piece that needs to be present (but boy, does this feel like the unix way...).
By far the most annoying part about anything Huion is that until relatively recently (I don't have a date but maybe until 2 years ago) all of Huion's devices shared the same few USB product IDs. For most of these devices we worked around it by matching on device names but there were devices that had the same product id and device name. At some point libwacom and the kernel and huion-switcher had to implement firmware ID extraction and matching so we could differ between devices with the same 0256:006d usb IDs. Luckily this seems to be in the past now with modern devices now getting new PIDs for each individual device. But if you have an older device, expect difficulties and, worse, things to potentially break after firmware updates when/if the firmware identification string changes. udev-hid-bpf (and uclogic) rely on the firmware strings to identify the device correctly.
edit: and of course less than 24h after posting this I process a bug report about two completely different new devices sharing one of the product IDs
Because we have a changeover from the hid-uclogic kernel driver to the udev-hid-bpf files there are rough edges on "where does this device go". The general rule is now: if it's not a shared product ID (see above) it should go into udev-hid-bpf and not the uclogic driver. Easier to maintain, much more fire-and-forget. Devices already supported by udev-hid-bpf will remain there, we won't implement BPFs for those (older) devices, doubly so because of the aforementioned libinput difficulties with some hid-uclogic features.
The newer tablets are always slightly different so we basically need to reverse-engineer each tablet to get it working. That's common enough for any device but we do rely on volunteers to do this. Mind you, the udev-hid-bpf approach is much simpler than doing it in the kernel, much of it is now copy-paste and I've even had quite some success to get e.g. Claude Code to spit out a 90% correct BPF on its first try. At least the advantage of our approach to change the report descriptor means once it's done it's done forever, there is no maintenance required because it's a static array of bytes that doesn't ever change.
Because we're abstracting the hardware, userspace needs to be fully plumbed. This was a problem last year for example when we (slowly) got support for relative wheels into libinput, then wayland, then the compositors, then the toolkits to make it available to the applications (of which I think none so far use the wheels). Depending on how fast your distribution moves, this may mean that support is months and years off even when everything has been implemented. On the plus side these new features tend to only appear once every few years. Nonetheless, it's not hard to see why the "just sent Ctrl=, that'll do" approach is preferred by many users over "probably everything will work in 2027, I'm sure".
A currently unsolved problem is the lack of tool IDs on all Huion tools. We cannot know if the tool used is the two-button + eraser PW600L or the three-button-one-is-an-eraser-button PW600S or the two-button PW550 (I don't know if it's really 2 buttons or 1 button + eraser button). We always had this problem with e.g. the now quite old Wacom Bamboo devices but those pens all had the same functionality so it just didn't matter. It would matter less if the various pens would only work on the device they ship with but it's apparently quite possible to use a 3 button pen on a tablet that shipped with a 2 button pen OOTB. This is not difficult to solve (pretend to support all possible buttons on all tools) but it's frustrating because it removes a bunch of UI niceties that we've had for years - such as the pen settings only showing buttons that actually existed. Anyway, a problem currently in the "how I wish there was time" basket.
Overall, we are in an ok state but not as good as we are for Wacom devices. The lack of tool IDs is the only thing not fixable without Huion changing the hardware[7]. The delay between a new device release and driver support is really just dependent on one motivated person reverse-engineering it (our BPFs can work across kernel versions and you can literally download them from a successful CI pipeline). The hid-uclogic split should become less painful over time and the same as the devices with shared USB product IDs age into landfill and even more so if libinput gains support for the separate event nodes for wheels/strips/... (there is currently no plan and I'm somewhat questioning whether anyone really cares). But other than that our main feature gap is really the ability for much more flexible configuration of buttons/wheels/... in all compositors - having that would likely make the requirement for OpenTabletDriver and the Huion tablet disappear.
The final topic here: what about the existing non-kernel drivers?
Both of these are userspace HID input drivers which all use the same approach: read from a /dev/hidraw node, create a uinput device and pass events back. On the plus side this means you can do literally anything that the input subsystem supports, at the cost of a context switch for every input event. Again, a diagram on how this looks like (mostly) below userspace:

Note how the kernel's HID devices are not exercised here at all because we parse the vendor report, create our own custom (separate) uinput device(s) and then basically re-implement the HID to evdev event mapping. This allows for great flexibility (and control, hence the vendor drivers are shipped this way) because any remapping can be done before you hit uinput. I don't immediately know whether OpenTabletDriver switches to firmware mode or maps the tablet mode but architecturally it doesn't make much difference.
From a security perspective: having a userspace driver means you either need to run that driver daemon as root or (in the case of OpenTabletDriver at least) you need to allow uaccess to /dev/uinput, usually via udev rules. Once those are installed, anything can create uinput devices, which is a risk but how much is up for interpretation.
[1] As is so often the case, even the intended state does not necessarily spark joy
[2] Again, we're talking about the intended case here...
[3] fsvo "no-one"
[4] The xf86-input-wacom driver always initialises a separate eraser tool even if you never press that button
[5] For historical reasons those are also multiplexed so getting ABS_Z on a device has different meanings depending on the tool currently in proximity
[6] In our udev-hid-bpf BPFs we hide those devices so you really only get the correct event nodes, I'm not immediately sure what hid-uclogic does
[7] At which point Pandora will once again open the box because most of the stack is not yet ready for non-Wacom tool ids
It may sound unbelievable to some, but not everyone has a datacenter beast with 128GB of VRAM shoved in their desktop PCs. Around the world people tell the tale of a particularly fierce group of Linux gamers: Those who dare attempt to play games with only 8 gigabytes of VRAM, or even less. Truly, it takes exceedingly strong resilience and determination to face the stutters and slowdowns bound to occur when the system starts running low on free VRAM. Carnage erupts inside the kernel driver as every application fights for as much GPU memory as it can hold on to. Any game caught up in this battle for resources will surely not leave unscathed.
That is, until now. Because I fixed it.
A: You need some kernel patches as well as additional utilities to make use of the kernel capabilities properly.
The simplest option is to use CachyOS (with KDE as your desktop). Their kernel includes the patches you need from version 7.0rc7-2 and up, and the userspace utilities are available in the
package repositories. All you need to do is use CachyOS’s 7.0rc7-2 kernel, install the packages called dmemcg-booster and plasma-foreground-booster, and you should be good to go.
UPDATE: CachyOS’s 6.19.12 kernel also includes this, now. No need to use the -rc kernel anymore.
The dmemcg-booster and plasma-foreground-booster utilities are available in the AUR as well (plasma-foreground-booster carries the package name plasma-foreground-booster-dmemcg), so you can install them from there.
For the kernel side, you can either use the CachyOS kernel package on a non-CachyOS system by retrieving the package from their repository,
or you can compile your own kernel. Installing linux-dmemcg from the AUR will compile the development branch I used to develop this.
Being a development branch, this carries the risk of some stuff being broken, so install at your own risk!
If you want to apply the kernel patches yourself, you need these six .patch files:
Patch 1
Patch 2
Patch 3
Patch 4
Patch 5
Patch 6
I’m not sure how easily they apply on specific kernel versions, but feel free to leave a comment if you run into issues and I’ll try to help out.
Maybe wait a bit. Eventually I’d expect this to trickle down into more distros. If I notice this work being packaged by other distros or being installable by other means, I will update this blogpost.
A: For games where you care about VRAM usage, you can use newer versions of gamescope. Newer versions of gamescope will also try to make use of these kernel capabilities,
so running your games through that should be sufficient. You will still need the dmemcg-booster utility in any case.
A: All the user-space utilities hard-depend on systemd. Without systemd, you’d need to write your own utilities that make use of my kernel patches. Something needs to manage cgroups in your system, and that something needs to enable the right cgroup controllers and set the right limits (see also the long-winded explanation about how this works).
Let’s first look at what problems we actually run into when we have games running on GPUs with little VRAM.
On a standard desktop system, the game won’t be the only application that runs on the GPU at a time at all. If it’s anything like my system, there’s always at least one browser window with way too many tabs open, plus an assortment of apps (many of which are actually web apps running in their own browsers under the hood). All of this eats up quite a bit of VRAM, as well.
To properly stress-test kernel memory management when working on this issue, I would go ahead and open up nearly every app with an integrated browser engine that I had installed. Viewed in amdgpu_top, the result of that looks something like this:

Ouch, there goes 1/4 of VRAM. Now, let’s try and launch Cyberpunk 2077 on top of that:

As expected, the game uses a lot of VRAM (I cranked the settings really high). However, a lot of memory allocations also end up in a memory region referred to as “GTT”. This is memory that is accessible by the GPU, but physically located in system RAM. From the GPU’s point of view, system RAM memory has to be accessed over the PCI bus. Accessing memory over the PCI bus is typically really, really slow. On my system, instead of the 256GB/s bandwidth VRAM could provide, we’re suddenly stuck with a meager 16GB/s at absolute maximum, paired with significantly worse latency.
Some amount of memory landing in GTT is normal - many games will intentionally allocate memory in GTT because it is advantageous for some use cases. However, Cyberpunk 2077 allocates a fixed amount of around 650MB of memory in GTT. Instead, what happened here is that the game requested some memory allocations in VRAM, but somehow, they ended up in GTT instead!
In kernel land, this process is referred to as eviction. The system in total tried to use more VRAM than there was available at all, so something had to give. Instead of telling the app that memory allocation failed (which would mean a near-certain application crash), the kernel decides to kick some memory out of VRAM to make everything fit. This degrades performance, but at least it allows every app to continue running. Nice! If only it would evict literally anything other than the game, which is the very thing that suffers the worst from having its memory evicted. Why in the world would it decide on that????
Memory eviction and behavior under VRAM pressure are by no means new issues. Over the course of time, different approaches have tried tackling different associated issues, and those different approaches introduced new issues themselves.
In the beginning, things worked rather simplistically: If applications wanted VRAM allocations, the user-mode driver would go to the kernel-mode driver and request VRAM memory. Save for some exceptional cases, that request would be granted, and that memory would be kept in VRAM. If another application requested VRAM allocations, and the memory was kicked out, the kernel driver would move the memory back into VRAM the next time work was submitted to the GPU using that memory.
This worked quite horribly. Generally, two competing applications can be expected to roughly take turns executing GPU work - first one application submits work, then the other, then the first again, and so on. With that approach, memory would keep being moved back and forth after every single submission. One application gets kicked out and immediately moved back in, kicking the other out (which moves memory back in the next step). All this moving ended up with worse performance than if the memory had never been moved in the first place.
The first bandaid solution was to rate-limit memory movement inside the kernel driver. Once the kernel driver moved enough memory within a specific time frame to trigger a limit, no more memory would be moved for some more time. This indeed reduced moves, but didn’t do anything to fix the underlying issue of repeated cyclic memory movements. Worse yet, repeatedly running into this ratelimit would introduce annoying jitters and stutters as the kernel driver rapidly alternated between moving memory and doing nothing.
Eventually, to combat the still-existing overhead of repeatedly moving memory, user-mode drivers changed their allocation strategy. Instead of specifying VRAM as the only acceptable domain to place the allocation in, every VRAM allocation request would specify both “VRAM” and “GTT” as possible memory domains. The kernel would interpret this as VRAM being preferred, but if there was no space, GTT was an acceptable fallback and the kernel wouldn’t try to kick out other VRAM memory to make space.
This change entirely stopped the issue with memory repeatedly moving in and out of VRAM. However, if you squint your eyes a bit, you can see the kernel conceptually performing an eviction here, too. If there is no space in VRAM, the newly allocated memory is immediately evicted. This “eviction” is incredibly cheap to perform, since you don’t actually need to move any memory, but the result is all the same: Memory that would ideally be in VRAM ends up in GTT.
This case is what we run into in Cyberpunk 2077 above. At some point, VRAM is full, and new allocations done by the game go straight to GTT. Clearly, that is the wrong decision to make here. But being more aggressive wouldn’t really work either - that was the approach before, and it was even worse. So what is the right decision here?
There is no single right decision to make here. Being aggressive is wrong, and not being aggressive is wrong, too. To be more specific, they’re wrong in different cases. It makes complete sense for a game to be aggressive, but it makes no sense for random background apps to be equally aggressive. Random background apps should not be aggressive at all, but if the game backs off equally quickly, that doesn’t help much either.
The real problem is that to the kernel driver, all memory looks the same. The kernel doesn’t know if it’s dealing with a highly-important object from a game or a static image from a random web app running in the background - all it sees is a list of buffers. As long as all buffers look the same, it is impossible to have the same approach work well for every one of all the wildly different situations a driver may encounter.
cgroups are cool. They’re super great at organizing random batches of processes into single organizational pieces. If you make a “compile job” cgroup and put the make process in it, all compiler processes it spawns will be part of that cgroup too.
Don’t want a big build hogging up all your RAM? Set a limit with the cgroup memory controller. Want to have some CPU time for other things? Just set a CPU limit with the cgroup cpu controller. It’s great. You can have cgroup hierarchies too, and represent almost any kind of complex resource
distribution you want.
Luckily, systemd agrees that cgroups are cool. Every systemd unit is actually represented with its own cgroup, as well. And, as it happens, desktop environments will represent each desktop app as a systemd unit.
How convenient! Complex resource distribution sounds exactly like the problems we’re having in GPU driver land. If only someone wrote a cgroup controller operating on memory allocations from arbitrary devices such as GPUs…

cgroups are a very clean solution for figuring out how relatively important GPU memory allocations are. Some time after Maarten Lankhorst from Intel initially wrote a cgroup controller managing GPU memory (initially only made for limiting how much VRAM one cgroup is allowed to consume), he pointed me to this work as a possible solution for the VRAM issues I was investigating. Eventually, this resulted in the dmem cgroup controller, written by Maarten, Maxime Ripard from Red Hat, and me.
With the dmem cgroup controller, the kernel now learns about “memory protection”. Memory being “protected” merely means that the kernel will go to significant lengths to avoid evicting that memory. For example, it may try to find memory from a different cgroup that is not protected and evict that instead. cgroups are all about resource partitioning, so for a cgroup, you can assign a “protection limit” - that is, if a cgroup’s memory usage is below that limit, its memory is protected. As soon as it exceeds the limit, the memory ceases to be protected and can more easily be evicted. This roughly corresponds to the “more aggressive” and “less aggressive” behaviors we used to have, but now we can have some applications (=cgroups) that are more aggressive and some that are less aggressive. Precisely what we wanted!
The dmem cgroup controller has been upstream for a while now, but for memory protection to work properly in gaming scenarios and such, you will likely still need my kernel patches.
Remember how Cyberpunk 2077 ends up with its memory in GTT because the kernel driver sees that VRAM is exhausted and puts new memory in GTT right away? I argued this is conceptually equivalent to an eviction, but under the hood, this and real evictions that move existing memory from VRAM to GTT work very differently. Among other things, protection by dmem cgroups did not apply to these “evictions” - this is what my kernel patches fix. Without them, the kernel is still not aggressive enough even if there is protection, and allocations will still end up in GTT.
Maybe the best thing about cgroups for VRAM management is that the prioritization is completely dynamic and configurable by userspace. Window managers can now determine whichever app is in the foreground and dedicate the highest priority to that app via its cgroup, completely without having to teach the GPU driver what a “window” or “foreground” is. For desktops, this is an important heuristic, but it’s totally not the kernel’s business to know the concept of a foreground app.
I personally use KDE Plasma as my desktop environment, so I went looking for how such a thing could be integrated into Plasma. Lo and behold, it was already done! Plasma people already developed the ForegroundBooster utility that listens to which app is currently in the foreground, and tries to give it higher prioritization (in this case: wrt. CPU time) than other apps. This prioritization was also done via cgroups, so adding VRAM prioritization in my fork was pretty much a walk in the park.
Except for one thing - the ForegroundBooster utility doesn’t manage cgroups and cgroup properties directly. systemd is responsible for managing cgroups, so ForegroundBooster just communicates with systemd to set the cgroup properties. That’s not too bad though, let’s just implement support for the dmem cgroup controller in systemd, right?
Well, this is what I thought, too. But as I alluded to before, fixing VRAM management for gaming purposes is by far not the only possible purpose of dmem cgroups. There are quite a few other use cases that people are eyeing dmem cgroups for, and if I were to implement a systemd interface while only considering the gaming scenario, the other use cases run the risk of having to deal with a systemd interface that wasn’t designed with that use case in mind at all. So for now, a common systemd implementation seems mostly off-limits until the dust has settled some more.
What do we do if we can’t tell systemd to do the thing we want? That’s right, we do it anyway, but behind systemd’s back. (Sorry, systemd.)
This is what the final piece of the puzzle, dmemcg-booster does (safely and 🚀blazingly fast🚀). After systemd constructs the cgroup hierarchy, dmemcg-booster goes over those cgroups and additionally enables the dmem controller on them, in order to activate the kernel functionality
that ultimately allows for GPU memory protection on those cgroups. While at it, it also sets some settings in the cgroup hierarchy that allow the memory protection to kick in properly.
Of course, this is a rather ugly stopgap. Once systemd gains proper support, you’d express all this with drop-in unit configurations, which is a much prettier approach. The dmemcg-booster utility is exclusively there to bridge the gap until that proper support happens.
With all the puzzle pieces finally in place, let’s repeat our test from before, launch a bunch of heavy apps, and then play Cyberpunk 2077 on top of that. How does it look now?

GTT memory usage is now down to 650MB, i.e. only the memory that the game explicitly allocated in system RAM itself. Not a single piece of memory got spilled!
Prioritization via cgroups now allows the game to use pretty much every last byte of VRAM for actual gaming purposes. It’s a bit hard to compare precise numbers on how the game performs, because the VRAM shortage slowly develops over time as you run around in the game, but the improvement should be obvious when comparing how games feel when you play them for a while. Instead of performance slowly degrading over time, games should perform much more stable - as long as the game itself doesn’t use more VRAM than you actually have. Generally, it seems like even modern games stay within a memory budget of ~8GB or a bit less, so if you have a GPU with 8GB of VRAM, you should be good to go with today’s games.
Whether or not your GPU can benefit from it depends on the kernel driver - more specifically, whether it sets up the dmem cgroup controller.
amdgpu and xe both have support for the dmem cgroup controller already. In theory, Intel GPUs running the xe kernel driver should benefit as well, although I’m not sure anyone tested this yet.
For nouveau, I have sent a patch for dmem cgroup support to the mailing lists.
This patch is also included in my development branch, so if you use my AUR package it should work. In other cases, you will need to wait for the patch to be picked up by your distribution, or apply it yourself.
The proprietary NVIDIA kernel modules do not support dmem cgroups yet, so this won’t work there.
I don’t actually know :)
The main problem (system RAM being slower than dedicated VRAM) does not exist on integrated GPUs, because they use system RAM for everything - so effects will most likely be more limited than on dGPUs. Maybe it still has some benefit? It probably requires careful testing to find out.
No, they haven’t arrived in upstream Linux yet, but I’ve sent them to the mailing lists and things are in-progress. I’ll update this when I know which mainline Linux release will pick these patches up.
I'm doing a podcast recording this week, so I wanted to run some numbers so I could have some facts rather than feels. It turns out my feels were off by a factor of 3 or so.
If asked, I've always said the contributor count to the drm subsystem is probably in the 100 or so developers per release cycle.
Did the simplest:
git log --format='%aN' v6.14..v6.15 drivers/gpu/drm/ include/uapi/drm/ include/drm/ | sort -u | wc -l
Iterated over a few kernel releases
v6.15 326
v6.16 322
v6.17 300
v6.18 334
v6.19 332
v7.0-rc6 346
The number for the complete kernel in those scenarios are ~2000 usually, which means drm subsystem has around 15-16% of the kernel contributors.
I'm a bit spun out, that's quite a lot of people. I think I'll blame Sima for it. This also explains why I'm a bit out of touch with the process problems other maintainers have, and when I say stuff like a lot of workflows don't scale, this is what I mean.
I published three Rust crates:
name_to_handle_at and open_by_handle_at system callsThey might seem like rather arbitrary, unconnected things – but there is a connection!
systemd socket activation passes file descriptors and a bit of metadata as environment variables to the activated process. If the activated process exec’s another program, the file descriptors get passed along because they are not CLOEXEC. If that process then picks them up, things could go very wrong. So, the activated process is supposed to mark the file descriptors CLOEXEC, and unset the socket activation environment variables. If a process doesn’t do this for whatever reason however, the same problems can arise. So there is another mechanism to help prevent it: another bit of metadata contains the PID of the target. Processes can check it against their own PID to figure out if they were the target of the activation, without having to depend on all other processes doing the right thing.
PIDs however are racy because they wrap around pretty fast, and that’s why nowadays we have pidfds. They are file descriptors which act as a stable handle to a process and avoid the ID wrap-around issue. Socket activation with systemd nowadays also passes a pidfd ID. A pidfd ID however is not the same as a pidfd file descriptor! It is the 64 bit inode of the pidfd file descriptor on the pidfd filesystem. This has the advantage that systemd doesn’t have to install another file descriptor in the target process which might not get closed. It can just put the pidfd ID number into the $LISTEN_PIDFDID environment variable.
Getting the inode of a file descriptor doesn’t sound hard. fstat(2) fills out struct stat which has the st_ino field. The problem is that it has a type of ino_t, which is 32 bits on some systems so we might end up with a process identifier which wraps around pretty fast again.
We can however use the name_to_handle syscall on the pidfd to get a struct file_handle with a f_handle field. The man page helpfully says that “the caller should treat the file_handle structure as an opaque data type”. We’re going to ignore that, though, because at least on the pidfd filesystem, the first 64 bits are the 64 bit inode. With systemd already depending on this and the kernel rule of “don’t break user-space”, this is now API, no matter what the man page tells you.
So there you have it. It’s all connected.
Obviously both pidfds and name_to_handle have more exciting uses, many of which serve my broader goal: making Varlink services a first-class citizen. More about that another time.
On March 17 we released systemd v260 into the wild.
In the weeks leading up to that release (and since then) I have posted a series of serieses of posts to Mastodon about key new features in this release, under the #systemd260 hash tag. In case you aren't using Mastodon, but would like to read up, here's a list of all 21 posts:
I intend to do a similar series of serieses of posts for the next systemd release (v261), hence if you haven't left tech Twitter for Mastodon yet, now is the opportunity.
My series for v261 will begin in a few weeks most likely, under the #systemd261 hash tag.
In case you are interested, here is the corresponding blog story for systemd v259, here for v258, here for v257, and here for v256.
More and more frequently, I get asked about my stance on AI in the context of programming. This is my attempt to summarize my stance for those who wonder.
This is a blog post that I don’t want to write, but some recent developments have more or less forced my hand here. I would have preferred to keep pretending that I’m neutral in the issue, and just hoping that the problem goes away. But that doesn’t seem to be happening.
I’m probably not the most qualified person to write about this, I’m sure you can find better informed articles out there. These are my personal opinions, and not those of my employer, their customers or any other of my affiliates. Take them with a pinch of salt, and feel free to disagree.
On a general note, I’m very reluctant to tell people how they should behave. But in this case, I’ve decided to do just that. I hope it’s clear why from the context.
Similarly, I would caution every reader to be skeptical of anyone who claims to know what the future holds, me included. People often predict the future that benefits themselves the most. There’s a few times I make some predictions in this post. Those are just predictions, and I might very well be wrong.
A final warning; this is a long post, so set aside some time. I’ve tried to limit the scope somewhat to mostly cover topics concerning open source development, but I sometimes end up discussing wider issues. This is simply because I don’t feel like I can ignore these.
But yeah, let’s start close to home here…
Currently, the legal status of AI generated code is still far from clear. Is it derivative work of all of the training data or not? It sometimes can be, but it depends on a lot of factors.
This is a critical issue to open source; I can’t submit code somewhere that I don’t know the origin of and potentially is license-incompatible with the upstream project. This isn’t just theoretical, Copilot has been known to output Quake 3 source code with the wrong license. It doesn’t matter if the people with the most to lose from AI output counting as derivative works keeps insisting not to worry.
The US supreme court recently made it clear that AI generated code isn’t even copyright-able. A human needs to write the code for copyright to be granted. But with using AI tools, we’re blurring the line, making it hard or even impossible to tell what is written by a human and what isn’t.
I also doubt that a single or a handful of lawsuits is going to be enough to settle this. We’re working in a global ecosystem, and there’s potentially hundreds of jurisdictions that might have to rule, and just as many subtleties to take into account before we have a good understanding around this. It’s going to take a long time to find out.
But even if this wasn’t an issue, does that really mean we should use AI? Open source software is inherently political, especially when it comes to licensing. I tend to find something not being illegal to be a terribly low standard to have. It should IMO also be the right thing to do. This brings us to the other issues…
As open source developers, it’s important for our infrastructure to be publicly available to everyone. In recent times, AI scrapers have started taking advantage of this, and are now aggressively scraping all content on open source support infrastructure so they can train their models. These scrapers often ignore robots.txt directives, and sometimes even use randomized, residential IP addresses, making it hard or impossible to effectively block them.
All of this has a major financial impact on open source projects. It’s not unusual to see over 90% of traffic provably coming from AI scrapers.
As a result, the open source community has had to introduce barriers, like Anubis, which slows down initial page-loads. Since Anubis is based on proof-of-work, it means people with slow computers can no longer reach our infrastructure. And I can’t reliably browse our GitLab instance from my phone on the bus to work.
While the latter is a minor annoyance, the former is a real problem for inclusivity.
And because our infrastructure is so heavily affected by this, it feels deeply problematic to me if we use (and pay for) the tools that are built on this behavior. That would be rewarding the behavior. We should vote with our wallets here, and in this case this means to not pay them.
Another issue is that code needs to be understood and maintained in the long term. For this to work well, we need to be able to reach out to the people that wrote the code and get input on what led to a decision. Obviously, that’s not always possible, but with AI this is almost never possible. The context is lost, and so is all the insight. Asking an AI again about the same code might lead to completely different reasoning, and miss crucial details.
The project I’m mostly working on, Mesa 3D, is also arguably critical infrastructure for a lot of computer systems around the world. We need to be lean towards being conservative rather than experimental when building these kinds of systems.
Another related issue is that AI technology tends to be used to take over more “junior” tasks, but the result of this is likely to be that we end up hiring and mentoring fewer junior developers. This will lead us to having fewer competent senior developers in the future.
Interacting with an AI isn’t going to gradually make the AI learn and become more senior, unlike with a junior developer. AIs learn from training, not queries. Mentoring junior developers builds trust, which makes the interactions worthwhile also for the senior. In my experience, interactions with AIs are little other than frustration that never improves. And because working with the AI doesn’t build any meaningful trust, the AIs will always need guard-rails to prevent disasters.
A future where we develop software with few to no human developers (junior or senior) sounds scary to me, but that’s where this path leads.
Building and running these huge data-centers is extremely resource heavy. Some of these resources are resources we all have to share on this planet, like water, electricity and rare earth minerals. This is taking a toll on our planet and everything living on it.
I feel like this point got a lot less attention recently than it used to, but it hasn’t really been solved. Instead, the AI giants have just doubled down on wanting to consume all the resources they feel they need, without regard for the planet or people living on it. They are far from truthful about how bad this is, and try to prevent us from knowing just how bad it is.
The truth is that AI-type solutions are almost always one of the most resource intensive solutions to problems possible. And right now we’re being told that we should use it for all problems. This is a recipe for disaster, nothing less.
And it seems like there’s nothing being done on this front. The big AI companies are just slowly boiling the ocean, hoping that we don’t notice or that we forget. I haven’t forgotten.
A secondary effect of building all these data-centers is that demand for a bunch of resources goes up, and so does the price. This affects everyone.
We’re not just seeing electricity and water being more scarce, we’re also seeing memory and storage prices spiking hard as well. Forget about buying a new GPU, and just generally wait a couple of years with buying a new computer, or really any new gadgets.
How can this possibly not lead to a recession if things are allowed to continue?
And then we have the blatant circular economy that the big AI players are doing to try to convince the market this is actually profitable. In reality, very little actual money is changing hands, they’re mostly just making promises to buy tech from each other in the future… Which brings us to the big one…
Yeah, so it seems very likely we’re currently in a bubble. We’ve been for a while, and this bubble is going to pop. The question is when and how.
Don’t get me wrong; not all bubbles pop and erase everything with it. The dot-com bubble took years to pop, and we still have computers and the internet and all that jazz.
But we’re currently overspending on infrastructure, and the companies selling that are currently raking in, and they are trying hard to make us all dependent on their technology.
For the last few years, the AI industry has slurped up most of the traditional technology investment capital available. The investors seem less and less interested in investing more money into the AI industry, and want return on their investments instead. So they have started turning to things like pension funds. If they get away with this, everyone is going to pay for this, regardless of their involvement in AI.
We’ve already been seeing the idea of “too big to fail” being thrown out there, mirroring what happened in the subprime mortgage crisis. We should, as a society refrain from letting them do this. These problems are caused by the AI industry, not by us consumers. We shouldn’t be the ones to bail them out when the time comes.
OpenAI’s CFO has already suggested that the U.S. government should provide a $1.4 trillion “safety net” for AI investments, and while Sam Altman since has walked that back after public outcry, this shows that these companies are already thinking along those lines.
On a more personal note, it’s kinda undeniable; I’m getting older, and part of getting old means that I need to spend more time actively thinking about things to keep up. Letting an AI take over the wheels, even just for the boring bits doesn’t help me, it only makes this worse. Keeping the brain sharp requires work, not assistance.
In fact, I often feel like I learn something useful, even when I do mundane tasks. Asking an LLM to write up a python script for me to do something robs me of learning in the process of doing it myself.
Add that to the data that suggests that we actually get less productive by using AI (while thinking we’re more productive), makes this all very unappealing to me. My brain is my most important tool, and I’m not going to risk it because tech CEOs are yelling at the world that they need to use AI to prevent a recession.
You might have noticed that I don’t really address the technical abilities of current AI technologies in this post. The reason is that I don’t feel like I need to; it’s kinda irrelevant.
I think the moral arguments against using AI for open source development are just too large to ignore. In fact, just the licensing and environmental issues alone would probably have been enough for me to draw a hard line in the sand here:
Using AI for open source projects is in my opinion immoral, and I will not be using it. I do not condone others using AI for anything in the open source ecosystem either. Using it is simply detrimental to our values and directly harms our community.
If you’re currently playing around with AI out of curiosity for open source projects, I would like to ask you to reconsider. If you’re working in a company that’s encouraging AI usage, I would like to ask you to speak up against it. If you are involved in policy decisions for open source projects, I would like to encourage you to try your best to discourage AI adoption within those projects.
Our entire ecosystem is on the line here. Not just the open source ecosystem, but the entire, global ecosystem. And I feel there’s not enough voices speaking up about it.
Make your voice heard! Allow yourself to be angry; there’s enough nonsense going out there! We need to stop this madness.
As I talked about in a couple of blog posts now I been working a lot with AI recently as part of my day to day job at Red Hat, but also spending a lot of evenings and weekend time on this (sorry kids pappa has switched to 1950’s mode for now). One of the things I spent time on is trying to figure out what the limitations of AI models are and what kind of use they can have for Open Source developers.
One thing to mention before I start talking about some of my concrete efforts is that I more and more come to conclude that AI is an incredible tool to hypercharge someone in their work, but I feel it tend to fall short for fully autonomous systems. In my experiments AI can do things many many times faster than you ordinarily could, talking specifically in the context of coding here which is what is most relevant for those of us in the open source community.
So one annoyance I had for years as a Linux user is that I get new hardware which has features that are not easily available to me as a Linux user. So I have tried using AI to create such applications for some of my hardware which includes an Elgato Light and a Dell Ultrasharp Webcam.
I found with AI and this is based on using Google Gemini, Claude Sonnet and Opus and OpenAI codex, they all required me to direct and steer the AI continuously, if I let the AI just work on its own, more often than not it would end up going in circles or diverging from the route it was supposed to go, or taking shortcuts that makes wanted output useless.On the other hand if I kept on top of the AI and intervened and pointed it in the right direction it could put together things for me in very short time spans.
My projects are also mostly what I would describe as end leaf nodes, the kind of projects that already are 1 person projects in the community for the most part. There are extra considerations when contributing to bigger efforts, and I think a point I seen made by others in the community too is that you need to own the patches you submit, meaning that even if an AI helped your write the patch you still need to ensure that what you submit is in a state where it can be helpful and is merge-able. I know that some people feel that means you need be capable of reviewing the proposed patch and ensuring its clean and nice before submitting it, and I agree that if you expect your patch to get merged that has to be the case. On the other hand I don’t think AI patches are useless even if you are not able to validate them beyond ‘does it fix my issue’.
My friend and PipeWire maintainer Wim Taymans and I was talking a few years ago about what I described at the time as the problem of ‘bad quality patches’, and this was long before AI generated code was a thing. Wim response to me which I often thought about afterwards was “a bad patch is often a great bug report”. And that would hold true for AI generated patches to. If someone makes a patch using AI, a patch they don’t have the ability to code review themselves, but they test it and it fixes their problem, it might be a good bug report and function as a clearer bug report than just a written description by the user submitting the report. Of course they should be clear in their bug report that they don’t have the skills to review the patch themselves, but that they hope it can be useful as a tool for pinpointing what isn’t working in the current codebase.
Anyway, let me talk about the projects I made. They are all found on my personal website Linuxrising.org a website that I also used AI to update after not having touched the site in years.
Elgato Light GNOME Shell extension

Elgato Light GNOME Shell extension
The first project I worked on is a GNOME Shell extension for controlling my Elgato Key Wifi Lamp. The Elgato lamp is basically meant for podcasters and people doing a lot of video calls to be able to easily configure light in their room to make a good recording. The lamp announces itself over mDNS, and thus can be controlled via Avahi. For Windows and Mac the vendor provides software to control their lamp, but unfortunately not for Linux.
There had been GNOME Shell extensions for controlling the lamp in the past, but they had not been kept up to date and their feature set was quite limited. Anyway, I grabbed one of these old extensions and told Claude to update it for latest version of GNOME. It took a few iterations of testing, but we eventually got there and I had a simple GNOME Shell extension that could turn the lamp off and on and adjust hue and brightness. This was a quite straightforward process because I had code that had been working at some point, it just needed some adjustments to work with current generation of GNOME Shell.
Once I had the basic version done I decided to take it a bit further and try to recreate the configuration dialog that the windows application offers for the full feature set which took me quite a bit of back and forth with Claude. I found that if I ask Claude to re-implement from a screenshot it recreates the functionality of the user interface first, meaning that it makes sure that if the screenshot has 10 buttons, then you get a GUI with 10 buttons. You then have to iterate both on the UI design, for example telling Claude that I want a dark UI style to match the GNOME Shell, and then I also had to iterate on each bit of functionality in the UI. Like most of the buttons in the UI didn’t really do anything from the start, but when you go back and ask Claude to add specific functionality per button it is usually able to do so.

Elgato Light Settings Application
So this was probably a fairly easy thing for the AI because all the functionality of the lamp could be queried over Avahi, there was no ‘secret’ USB registers to be set or things like that.
Since the application was meant to be part of the GNOME Shell extension I didn’t want to to have any dependency requirements that the Shell extension itself didn’t have, so I asked Claude to make this application in JavaScript and I have to say so far I haven’t seen any major differences in terms of the AIs ability to generate different languages. The application now reproduce most of the functionality of the Windows application. Looking back I think it probably took me a couple of days in total putting this tool together.

Dell UltraSharp 4K settings application for Linux
The second application on the list is a controller application for my Dell UltraSharp Webcam 4K UHD (WB7022). This is a high end Webcam I that have been using for a while and it is comparable to something like the Logitech BRIO 4K webcam. It has mostly worked since I got it with the generic UVC driver and I been using it for my Google Meetings and similar, but since there was no native Linux control application I could not easily access a lot of the cameras features. To address this I downloaded the windows application installer and installed it under Windows and then took a bunch of screenshots showcasing all features of the application. I then fed the screenshots into Claude and told it I wanted a GTK+ version for Linux of this application. I originally wanted to have Claude write it in Rust, but after hitting some issues in the PipeWire Rust bindings I decided to just use C instead.
I took me probably 3-4 days with intermittent work to get this application working and Claude turned out to be really good and digging into Windows binaries and finding things like USB property values. Claude was also able to analyze the screenshots and figure out the features the application needed to have. It was a lot of trial and error writing the application, but one way I was able to automate it was by building a screenshot option into the application, allowing it to programmatically take screenshots of itself. That allowed me to tell Claude to try fixing something and then check the screenshot to see if it worked without me having to interact with the prompt. Also to get the user interface looking nicer, once I had all the functionality in I asked Claude to tweak the user interface to follow the guidelines of the GNOME Human Interface Guidelines, which greatly improved the quality of the UI.
At this point my application should have almost all the features of the Windows application. Since it is using PipeWire underneath it is also tightly integrated with the PipeWire media graph, allowing you to see it connect and work with your application in PipeWire patchbay applications like Helvum. The remaining features are software features of Dell’s application, like background removal and so on, but I think that if I decided to to implement that it should be as a standalone PipeWire tool that can be used with any camera, and not tied to this specific one.

The application shows the worlds Red Hat offices and include links to latest Red Hat news.
I decided if I was going to revisit the Vulkan problem I wanted to use a different application idea than traceroute. The idea I had was once again a 3D rendered globe, but this one reading the coordinates of Red Hats global offices from a file and rendering them on the globe. And alongside that provide clickable links to recent Red Hat news items. So once again maybe not the worlds most useful application, but I thought it was a cute idea and hopefully it would allow me to create it using actual Vulkan rendering this time.
Creating this turned out to be quite the challenge (although it seems to have gotten easier since I started this effort), with Claude Opus 4.6 being more capable at writing Vulkan code than Claude Sonnet, Google Gemini or OpenAI Codex was when I started trying to create this application.
When I started this project I had to keep extremely close tabs on the AI and what is was doing in order to force it to keep working on this as a Vulkan application, as it kept wanting to simplify with Software rendering or OpenGL and sometimes would start down that route without even asking me. That hasn’t happened more recently, so maybe that was a problem of AI of 5 Months ago.
I also discovered as part of this that rendering Vulkan inside a GTK4 application is far from trivial and would ideally need the GTK4 developers to create such a widget to get rendering timings and similar correct. It is one of the few times I have had Claude outright say that writing a widget like that was beyond its capabilities (haven’t tried again so I don’t know if I would get the same response today). So I started moving the application to SDL3 first, which worked as I got a spinning globe with red dots on, but came with its own issues, in the sense that SDL is not a UI toolkit as such. So while I got the globe rendered and working the AU struggled badly with the news area when using SDL.
So I ended up trying to port the application to Qt, which again turned out to be non-trivial in terms of how much time it took with trial and error to get it right. I think in my mind I had a working globe using Vulkan, how hard could it be to move it from SDL3 to Qt, but there was a million rendering issues. In fact I ended up using the Qt Vulkan rendering example as a starting point in the end and then ‘porting’ the globe over bit by bit, testing it for each step, to finally get a working version. The current version is a Vulkan+Qt app and it basically works, although it seems the planet is not spinning correctly on AMD systems at the moment, while it seems to work well on Intel and NVIDIA systems.

WmDock fullscreen with config application.
My initial thought was for Claude to create a shim that the old dockapps could be compiled against, without any changes. That worked, but then I had a ton of dockapps showing up in things like the alt+tab menu. It also required me to restart my GNOME Shell session all the time as I was testing the extension to house the dockapps. In the end I decided that since a lot of the old dockapps don’t work with modern Linux versions anyway, and thus they would need to be actively ported, I should accept that I ship the dockapps with the tool and port them to work with modern linux technologies. This worked well and is what I currently have in the repo, I think the wildest port was porting the old dockapp webcam app from V4L1 to PipeWire. Although updating the soundcontroller from ESD to PulesAudio was also a generational jump.

XMMS brought back to life
Monkey Bubble

Monkey Bubble was a game created in the heyday of GNOME 2 and while I always thought it was a well made little game it had never been updated to never technologies. So I asked Claude to port it to GTK4 and use GStreamer for audio.This port was fairly straightforward with Claude having little problems with it. I also asked Claude to add highscores using the libmanette library and network game discovery with Avahi. So some nice little.improvements.
All the applications are available either as Flatpaks or Fedora RPMS, through the gitlab project page, so I hope people enjoy these applications and tools. And enoy the blasts from the past as much as I did.
Worries about Artifical Intelligence
When I speak to people both inside Red Hat and outside in the community I often come across negativity or even sometimes anger towards Artificial Intelligence in the coding space. And to be clear I to worry about where things could be heading and how it will affect my livelihood too, so I am not unsympathetic to those worries at all. I probably worry about these things at least a few times a day. At the same time I don’t think we can hide from or avoid this change, it is happening with or without us. We have to adapt to a world where this tool exists, just like our ancestors have adapted to jobs changing due to industrialization and science before. So do I worry about the future, yes I do. Do I worry about how I might personally get affected by this? yes, I do. Do I worry about how society might change for the worse due to this? yes, I do. But I also remind myself that I don’t know the future and that people have found ways to move forward before and society has survived and thrived. So what I can control is that I try to be on top of these changes myself and take advantage of them where I can and that is my recommendation to the wider open source community on this too. By leveraging them to move open source forward and at the same time trying to put our weight on the scale towards the best practices and policies around Artificial Intelligence.
The Next Test and where AI might have hit a limit for me.
So all these previous efforts did teach me a lot of tricks and helped me understand how I can work with an AI agent like Claude, but especially after the success with the webcam I decided to up the stakes and see if I could use Claude to help me create a driver for my Plustek OpticFilm 8200i scanner. So I have zero backround in any kind of driver development and probably less than zero in the field of scanner driver specifically. So I ended up going down a long row of deadends on this journey and I to this day has not been able to get a single scan out of the scanner with anything that even remotely resembles the images I am trying to scan.
My idea was to have Claude analyse the Windows and Mac driver and build me a SANE driver based on that, which turned out to be horribly naive and lead nowhere. One thing I realized is that I would need to capture USB traffic to help Claude contextualize some of the findings it had from looking at the Windows and Mac drivers.I started out with Wireshark and feeding Claude with the Wireshark capture logs. Claude quite soon concluded that the Wireshark logs wasn’t good enough and that I needed lower level traffic capture. Buying a USB packet analyzer isn’t cheap so I had the idea that I could use one of the ARM development boards floating around the house as a USB relay, allowing me to perfectly capture the USB traffic. With some work I did manage to set up my LibreComputer Solitude AML-S905D3-CC arm board going and setting it in device mode. I also had a usb-relay daemon going on the board. After a lot of back and forth, and even at one point trying to ask Claude to implement a missing feature in the USB kernel stack, I realized this would never work and I ended up ordering a Beagle USB 480 USB hardware analyzer.
At about the same time I came across the chipset documentation for the Genesys Logic GL845 chip in the scanner. I assumed that between my new USB analyzer and the chipset docs this would be easy going from here on, but so far no. I even had Claude decompile the windows driver using ghidra and then try to extract the needed information needed from the decompiled code.
I bought a network controlled electric outlet so that Claude can cycle the power of the scanner on its own.
So the problem here is that with zero scanner driver knowledge I don’t even know what I should be looking for, or where I should point Claude to, so I keept trying to brute force it by trial and error. I managed to make SANE detect the scanner and I managed to get motor and lamp control going, but that is about it. I can hear the scanner motor running and I ask for a scan, but I don’t know if it moves correctly. I can see light turning on and off inside the scanner, but I once again don’t know if it is happening at the correct times and correct durations. And Claude has of course no way of knowing either, relying on me to tell it if something seems like it has improved compared to how it was.
I have now used Claude to create two tools for Claude to use, once using a camera to detect what is happening with the light inside the scanner and the other recording sound trying to compare the sound this driver makes compared to the sounds coming out when doing a working scan with the MacOS X application. I don’t know if this will take me to the promised land eventually, but so far I consider my scanner driver attempt a giant failure. At the same time I do believe that if someone actually skilled in scanner driver development was doing this they could have guided Claude to do the right things and probably would have had a working driver by now.
So I don’t know if I hit the kind of thing that will always be hard for an AI to do, as it has to interact with things existing in the real world, or if newer versions of Claude, Gemini or Codex will suddenly get past a threshold and make this seem easy, but this is where things are at for me at the moment.
In Chapter 1 I gave the context for this project and in Chapter 2 I showed the bare minimum: an ELF that Open Firmware loads, a firmware service call, and an infinite loop.
That was July 2024. Since then, the project has gone from that infinite loop to a bootloader that actually boots Linux kernels. This post covers the journey.
The Boot Loader Specification expects BLS snippets in a FAT filesystem under loaders/entries/. So the bootloader needs to parse partition tables, mount FAT, traverse directories, and read files. All #![no_std], all big-endian PowerPC.
I tried writing my own minimal FAT32 implementation, then integrating simple-fatfs and fatfs. None worked well in a freestanding big-endian environment.
The breakthrough was hadris, a no_std Rust crate supporting FAT12/16/32 and ISO9660. It needed some work to get going on PowerPC though. I submitted fixes upstream for:
thiserror pulling in std: default features were not disabled, preventing no_std builds.u32. On x86 that’s invisible; on big-endian PowerPC it produced garbage cluster chains.read_to_vec() to coalesce contiguous fragments into a single I/O. This made kernel loading practical.All patches were merged upstream.
Hadris expects Read + Seek traits. I wrote a PROMDisk adapter that forwards to OF’s read and seek client calls, and a Partition wrapper that restricts I/O to a byte range. The filesystem code has no idea it’s talking to Open Firmware.
PowerVM with modern disks uses GPT (via the gpt-parser crate): a PReP partition for the bootloader and an ESP for kernels and BLS entries.
Installation media uses MBR. I wrote a small mbr-parser subcrate using explicit-endian types so little-endian LBA fields decode correctly on big-endian hosts. It recognizes FAT32, FAT16, EFI ESP, and CHRP (type 0x96) partitions.
The CHRP type is what CD/DVD boot uses on PowerPC. For ISO9660 I integrated hadris-iso with the same Read + Seek pattern.
Boot strategy? Try GPT first, fall back to MBR, then try raw ISO9660 on the whole device (CD-ROM). This covers disk, USB, and optical media.
This cost me a lot of time.
Open Firmware provides claim and release for memory allocation. My initial approach was to implement Rust’s GlobalAlloc by calling claim for every allocation. This worked fine until I started doing real work: parsing partitions, mounting filesystems, building vectors, sorting strings. The allocation count went through the roof and the firmware started crashing.
It turns out SLOF has a limited number of tracked allocations. Once you exhaust that internal table, claim either fails or silently corrupts state. There is no documented limit; you discover it when things break.
The fix was to claim a single large region at startup (1/4 of physical RAM, clamped to 16-512 MB) and implement a free-list allocator on top of it with block splitting and coalescing. Getting this right was painful: the allocator handles arbitrary alignment, coalesces adjacent free blocks, and does all this without itself allocating. Early versions had coalescing bugs that caused crashes which were extremely hard to debug – no debugger, no backtrace, just writing strings to the OF console on a 32-bit big-endian target.
March 7, 2026. The commit message says it all: “And the kernel boots!”
The sequence:
BLS discovery: walk loaders/entries/*.conf, parse into BLSEntry structs, filter by architecture (ppc64le), sort by version using rpmvercmp.
ELF loading: parse the kernel ELF, iterate PT_LOAD segments, claim a contiguous region, copy segments to their virtual address offsets, zero BSS.
Initrd: claim memory, load the initramfs.
Bootargs: set /chosen/bootargs via setprop.
Jump: inline assembly trampoline – r3=initrd address, r4=initrd size, r5=OF client interface, branch to kernel:
core::arch::asm!(
    "mr 7, 3",   // save of_client
    "mr 0, 4",   // r0 = kernel_entry
    "mr 3, 5",   // r3 = initrd_addr
    "mr 4, 6",   // r4 = initrd_size
    "mr 5, 7",   // r5 = of_client
    "mtctr 0",
    "bctr",
    in("r3") of_client,
    in("r4") kernel_entry,
    in("r5") initrd_addr as usize,
    in("r6") initrd_size as usize,
    options(nostack, noreturn)
)
One gotcha: do NOT close stdout/stdin before jumping. On some firmware, closing them corrupts /chosen and the kernel hits a machine check. We also skip calling exit or release – the kernel gets its memory map from the device tree and avoids claimed regions naturally.
I implemented a GRUB-style interactive menu:
e: edit the kernel command line with cursor navigation and word jumping (Ctrl+arrows).This runs on the OF console with ANSI escape sequences. Terminal size comes from OF’s Forth interpret service (#columns / #lines), with serial forced to 80×24 because SLOF reports nonsensical values.
IBM POWER has its own secure boot: the ibm,secure-boot device tree property (0=disabled, 1=audit, 2=enforce, 3=enforce+OS). The Linux kernel uses an appended signature format – PKCS#7 signed data appended to the kernel file, same format GRUB2 uses on IEEE 1275.
I wrote an appended-sig crate that parses the appended signature layout, extracts an RSA key from a DER X.509 certificate (compiled in via include_bytes!), and verifies the signature (SHA-256/SHA-512) using the RustCrypto crates, all no_std.
The unit tests pass, including an end-to-end sign-and-verify test. But I have not tested this on real firmware yet. It needs a PowerVM LPAR with secure boot enforced and properly signed kernels, which QEMU/SLOF cannot emulate. High on my list.
The crate has grown well beyond Chapter 2. It now provides: claim/release, the custom heap allocator, device tree access (finddevice, getprop, instance-to-package), block I/O, console I/O with read_stdin, a Forth interpret interface, milliseconds for timing, and a GlobalAlloc implementation so Vec and String just work.
Published on crates.io at github.com/rust-osdev/ieee1275-rs.
I would like to test the Secure Boot feature on an end to end setup but I have not gotten around to request access to a PowerVM PAR. Beyond that I want to refine the menu. Another idea would be to perhaps support the equivalent of the Unified Kernel Image using ELF. Who knows, if anybody finds this interesting let me know!
The source is at the powerpc-bootloader repository. Contributions welcome, especially from anyone with POWER hardware access.
The Wayland core protocol has described surface state updates the same way since the beginning: requests modify pending state, commits either apply that state immediately or cache it into the parent for synchronized subsurfaces. Compositors implemented this model faithfully. Then things changed.
The problem emerged from GPU work timing. When a client commits a surface with a buffer, that buffer might still have GPU rendering in progress. If the compositor applies the commit immediately, it would display incomplete content—glitches. If the compositor submits its own GPU work with a dependency on the unfinished client work, it risks missing the deadlines for the next display refresh cycles and even worse stalling in some edge cases.
To get predictable timing, the compositor needs to defer applying commits until the GPU work finishes. This requires tracking readiness constraints on committed state.
Mutter was the first compositor to address this by implementing constraints and dependency tracking of content updates internally. Instead of immediately applying or caching commits, Mutter queued the changes in what we now call content updates, and only applied them when ready. Critically, this was an internal implementation detail. From the client’s perspective, the protocol semantics remained unchanged. Mutter had deviated from the implementation model implied by the specification while maintaining the observable behavior.
When we wanted better frame timing control and a proper FIFO presentation modes on Wayland, we suddenly required explicit queuing of content updates to describe the behavior of the protocols. You can’t implement FIFO and scheduling of content updates without a queue, so both the fifo and commit-timing protocols were designed around the assumption that compositors maintain per-surface queues of content updates.
These protocols were implemented in compositors on top of their internal queue-based architectures, and added to wayland-protocols. But the core protocol specification was never updated. It still described the old “apply or cache into parent state” model that has no notion of content updates, and per-surface queues.
We now had a situation where the core protocol described one model, extension protocols assumed a different model, and compositors implemented something that sort of bridged both.
That situation is not ideal: If the internal implementation follows the design which the core protocol implies, you can’t deal properly with pending client GPU work, and you can’t properly implement the latest timing protocols. To understand and implement the per-surface queue model, you would have to read a whole bunch of discussions, and most likely an implementation such as the one in mutter. The implementations in compositors also evolved organically, making them more complex than they actually have to be. To make matter worse, we also lacked a shared vocabulary for discussing the behavior.
The obvious solution to this is specifying a general model of the per-surface content update queues in the core protocol. Easier said than done though. Coming up with a model that is sufficient to describe the new behavior while also being compatible with the old behavior when no constraints on content updates defer their application was harder than I expected.
Together with Julian Orth, we managed to change the Wayland core protocol, and I wrote documentation about the system.
Recently Pekka Paalanen and Julian Orth reviewed the work, which allowed it to land. The updated and improved Wayland book should get deployed soon, as well.
The end result is that if you ever have to write a Wayland compositor, one of the trickier parts to get right should now be almost trivial. Implement the rules as specified, and things should just work. Edge cases are handled by the general rules rather than requiring special knowledge.
A wild blog appears…
A couple months ago the DRM/KMS Plane Color Pipeline API was merged after more than 2 years of work and deep discussions. Many people worked on it and it’s nice to see it upstream. KWin and other compositors implemented support for it. I’ll mainly focus on kwin here because that’s what I use regularly and what I am most familiar with. I will also focus on AMD HW because that’s what I’m working on.
On AMD HW with a kernel that includes the new Color Pipeline API KWin enables HW composition for surfaces that update more than 20 times per second on a single enabled display. It needs a few other things to match as well. In particular, this means that running mpv with the default backend (--vo=gpu) will use HW composition for mpv’s video surface with the rest of the desktop. The easiest way to observe this is with UMR by running it in --gui mode and looking at the KMS tab.
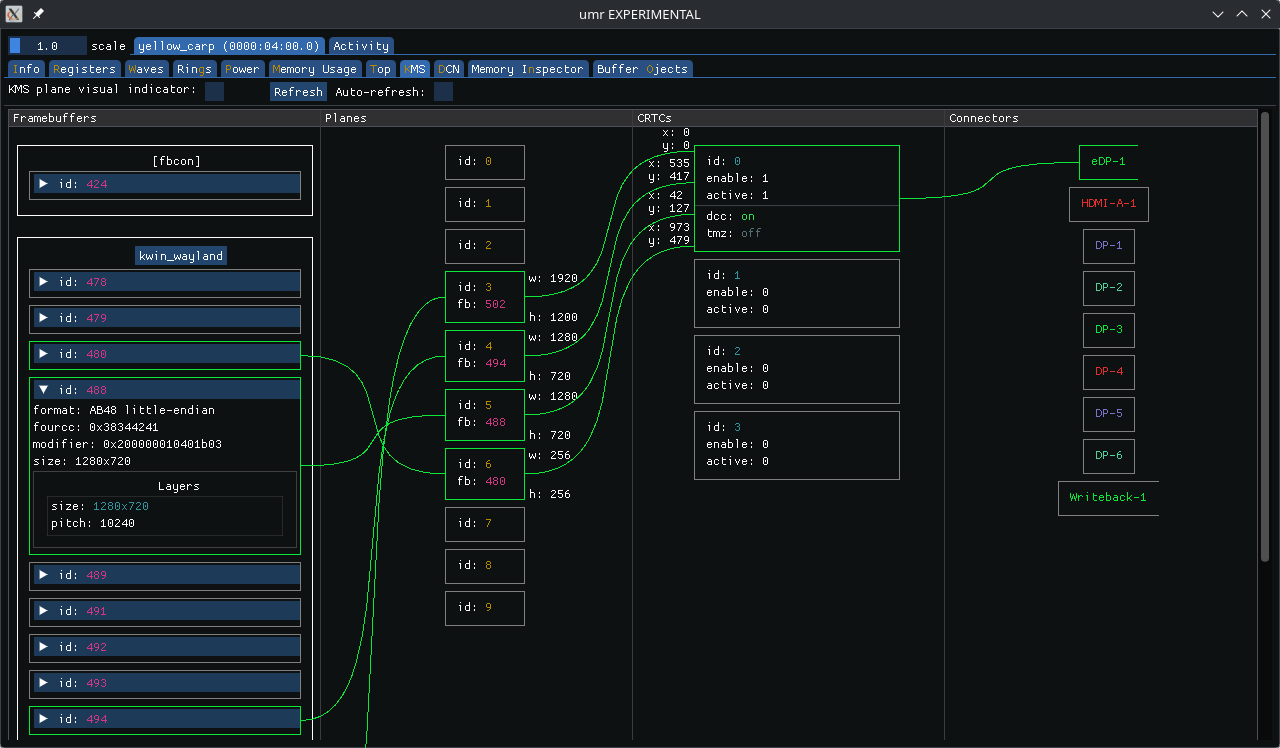
In my examples UMR also gets HW composed, so this shows 4 planes:
The mpv framebuffer shows up as an AB48 buffer, not NV12. This is because the --vo=gpu backend in mpv performs any required color-space conversation, scaling, and tone-mapping, and then offers up a 16-bpc buffer to the Wayland compositor, which kwin passes to the DRM/KMS driver.
We can tell mpv to pass the raw YUV buffer (NV12 or P010) to kwin by passing using the --vo=dmabuf-wayland backend. This tells mpv to simply decode the video stream but leave the buffer alone. It then passes the buffer information to kwin via the Wayland color-management and color-representation protocol extensions.
When we do this we don’t see a HW-composed plane in umr. KWin color-space converts, scales, tone-maps, and composes the plane via OpenGL. It can’t offload it to display HW because the DRM color pipeline API doesn’t yet support color-space conversion (CSC). The drm_plane does have COLOR_RANGE and COLOR_ENCODING properties to specify CSC, but they are deprecated with the color pipeline API.
So I went and implemented a CSC drm_colorop, added IGT tests and added support for it in kwin.
With this new CSC colorop we now see an NV12 buffer for our SDR video (I’m using a 1080p60 Big Buck Bunny clip).
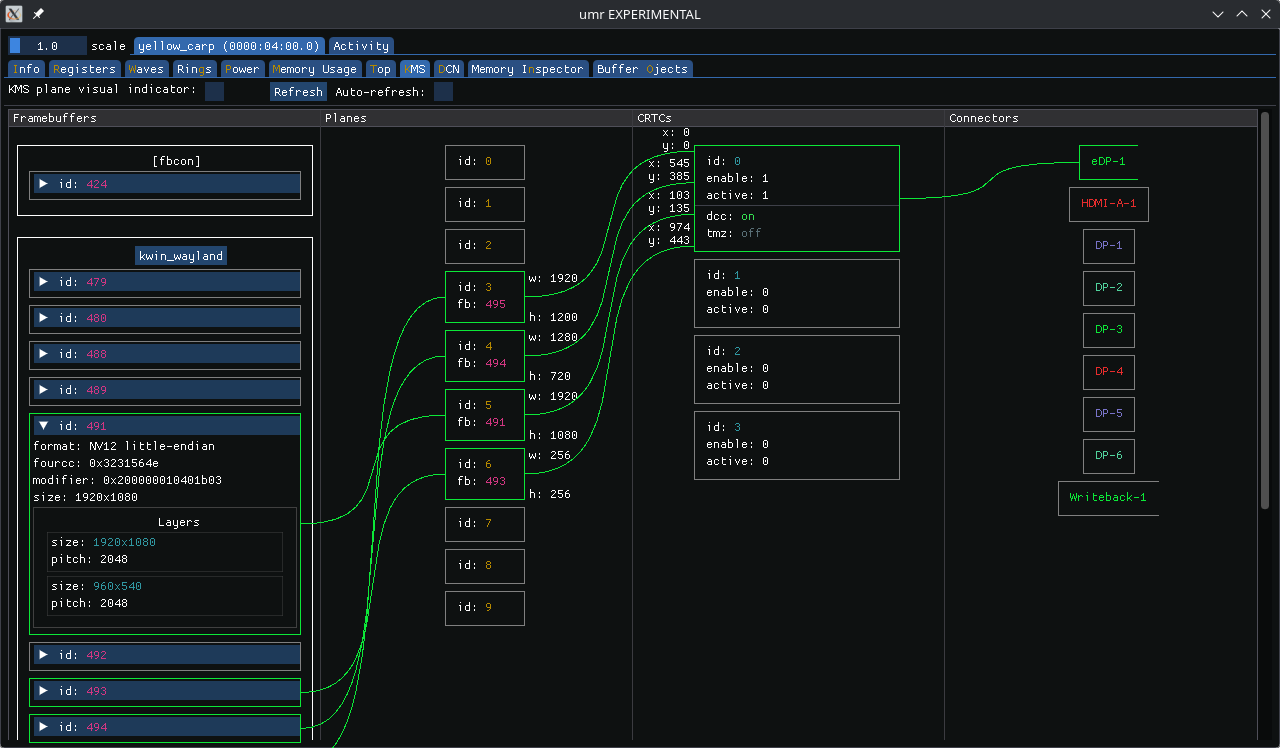
Unfortunately we see some banding during the HW composed Big Buck Bunny playback:

This is the SW composed version, showing no problems:

I haven’t yet debugged the banding. It seems to happen with one of the 1D LUTs.
But the AMD HW also has a 3D LUT and kwin lets us sample its entire internal color pipeline, so we can simply sample it at our 3DLUT coordinates and program it to HW. This allows us to represent any complex color pipeline with a single 3D LUT operation. The result is this.

In order to compose HDR content kwin creates a tone-mapper. By packing the entire color pipeline into a 3D LUT we don’t need to worry about it and get support for HW composition of HDR content for free.
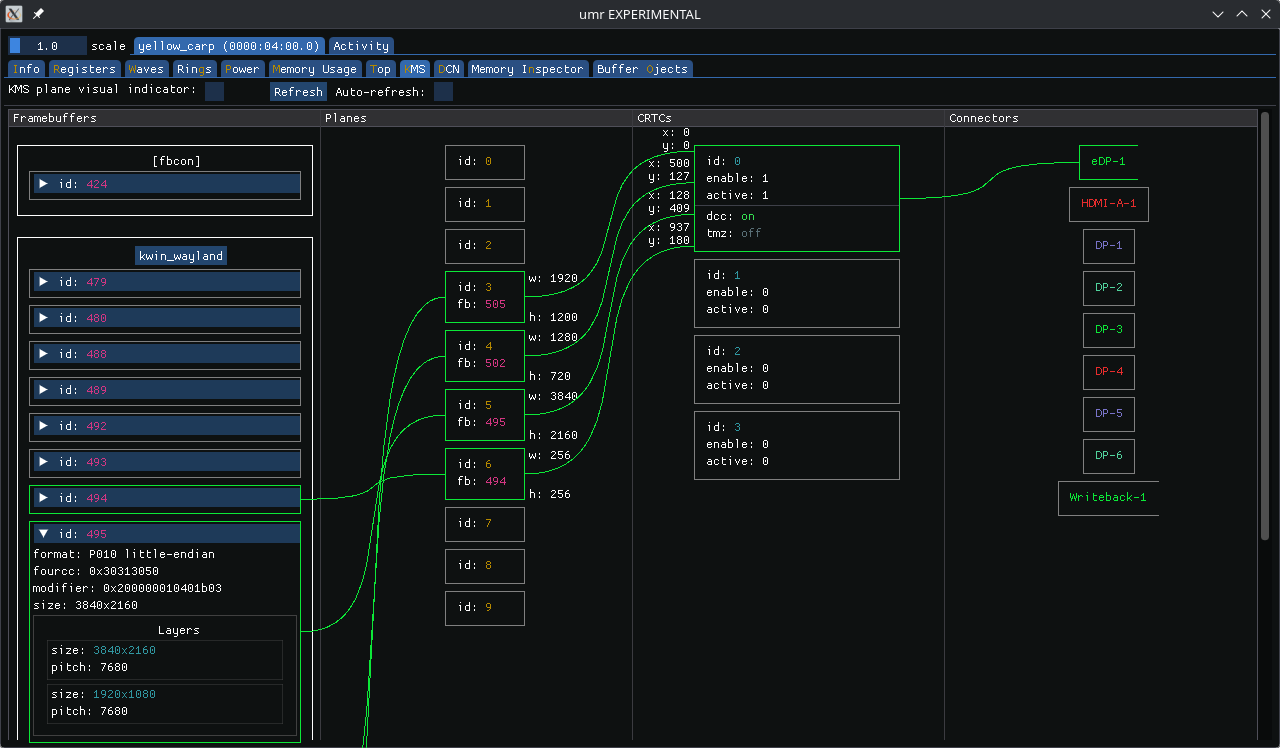
Note: AMD’s 3D LUT uses 17 entries per dimension and interpolates tetrahedrally. This will give good results when applied in non-linear luminance space. KWin blends in non-linear space, and the input buffer is non-linear, so it works well here. While this gives good results you might still observe minor differences, especially in brighter areas of the image. This can be observed when toggling between HW and SW composition in certain scenes.
Because AMD’s DCN HW uses a multi-tap scaler filter but kwin’s SW composition uses GL_LINEAR there are differences in scaling. It’s apparent when doing 4-to-1 downscaling, such as when scaling this 4k (HDR) video down to 720p.
SW composed:

HW composed:

The former has stronger aliasing. The latter looks softer and more natural, in my opinion. The difference becomes much less pronounced when the image is downscaled less, e.g., from 4k to 1080p.
At this point there is no good API to help align the two. GL seems to only have GL_NEAREST and GL_LINEAR when not dealing with mipmaps. DRM/KMS provides “Default” and “Nearest Neighbor” via the SCALING_FILTER property. While this allows us to use a nearest neighbor filter in both cases that’s undesirable since it’ll make the image worse in both cases.
When I started this work I asked myself: How do I see whether a surface is a candidate for offloading? How do I see which actual surface is being offloaded?
To solve this I worked with Claude to create a plugin that marks surfaces and their offload status:
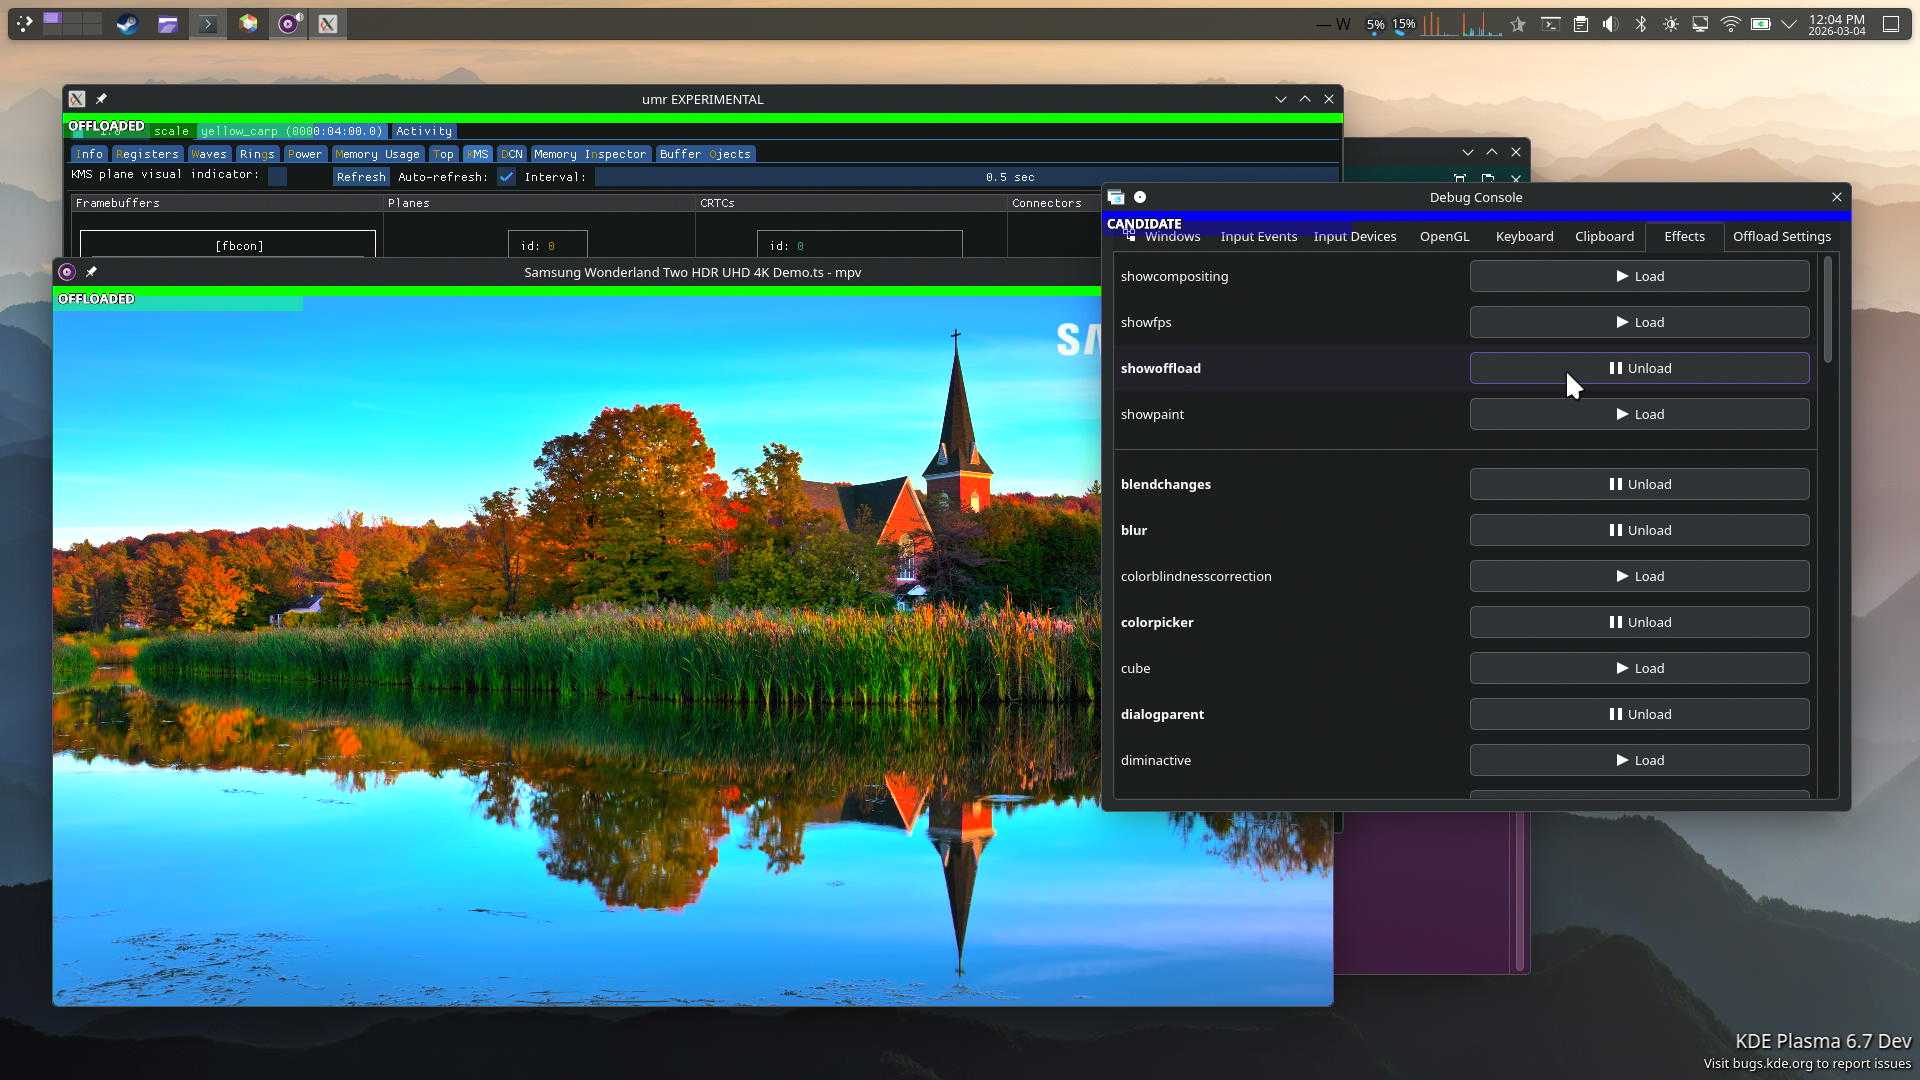
It’s quite useful to see immediately which surfaces are candidates, and why they might fail to offload.
I’ve also added a new tab to dynamically toggle HW composition and and off. The screenshot shows toggles for 3D LUT and tone-mapping and while we can add those as well they don’t always take effect as expected, so I left them out of the branch that’s linked below. But the ability to toggle HW composition is quite powerful when debugging HW composition issues.
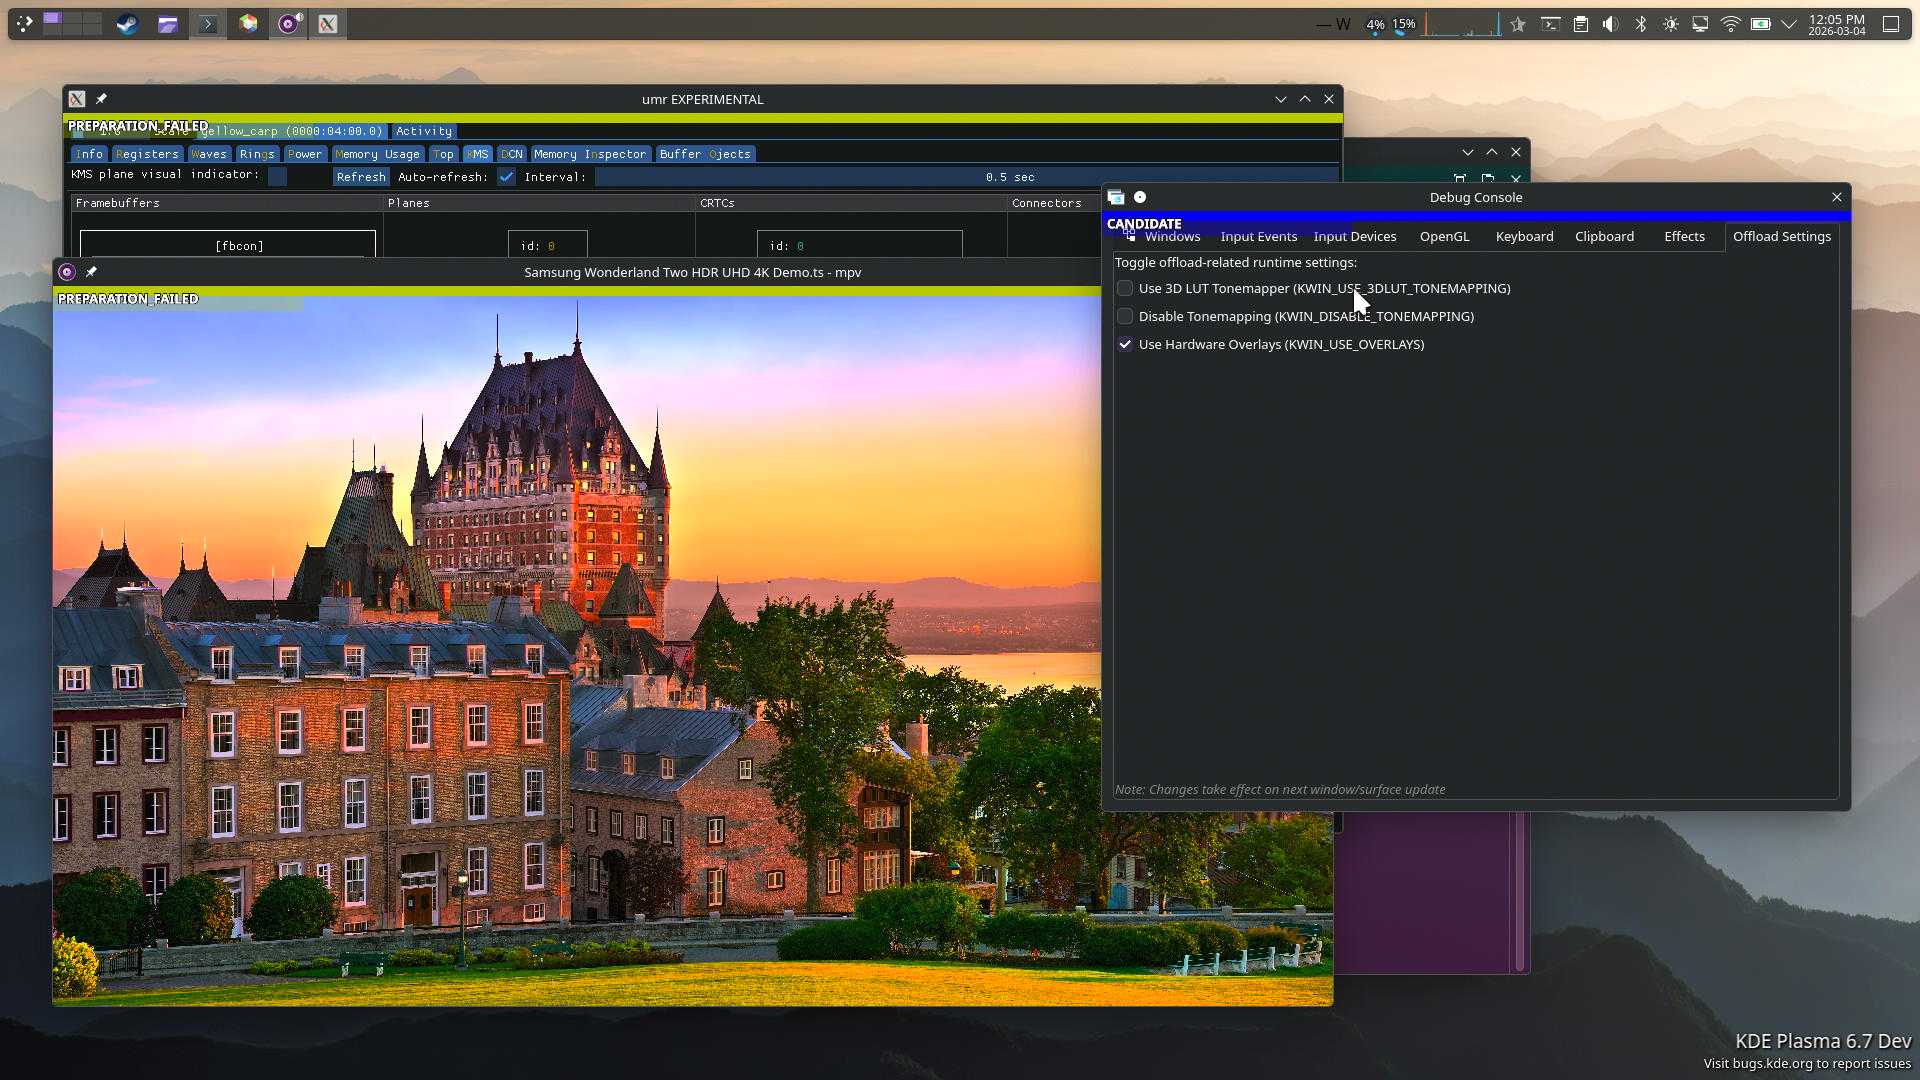
kwin branch on top of csc-3dlut branch
DCN HW programming can be logged via the amdgpu_dm_dtn_log debug log debugfs. But that log is quite extensive. It can be useful to show this in UMR with auto-update functionality to see programmed settings immediately.
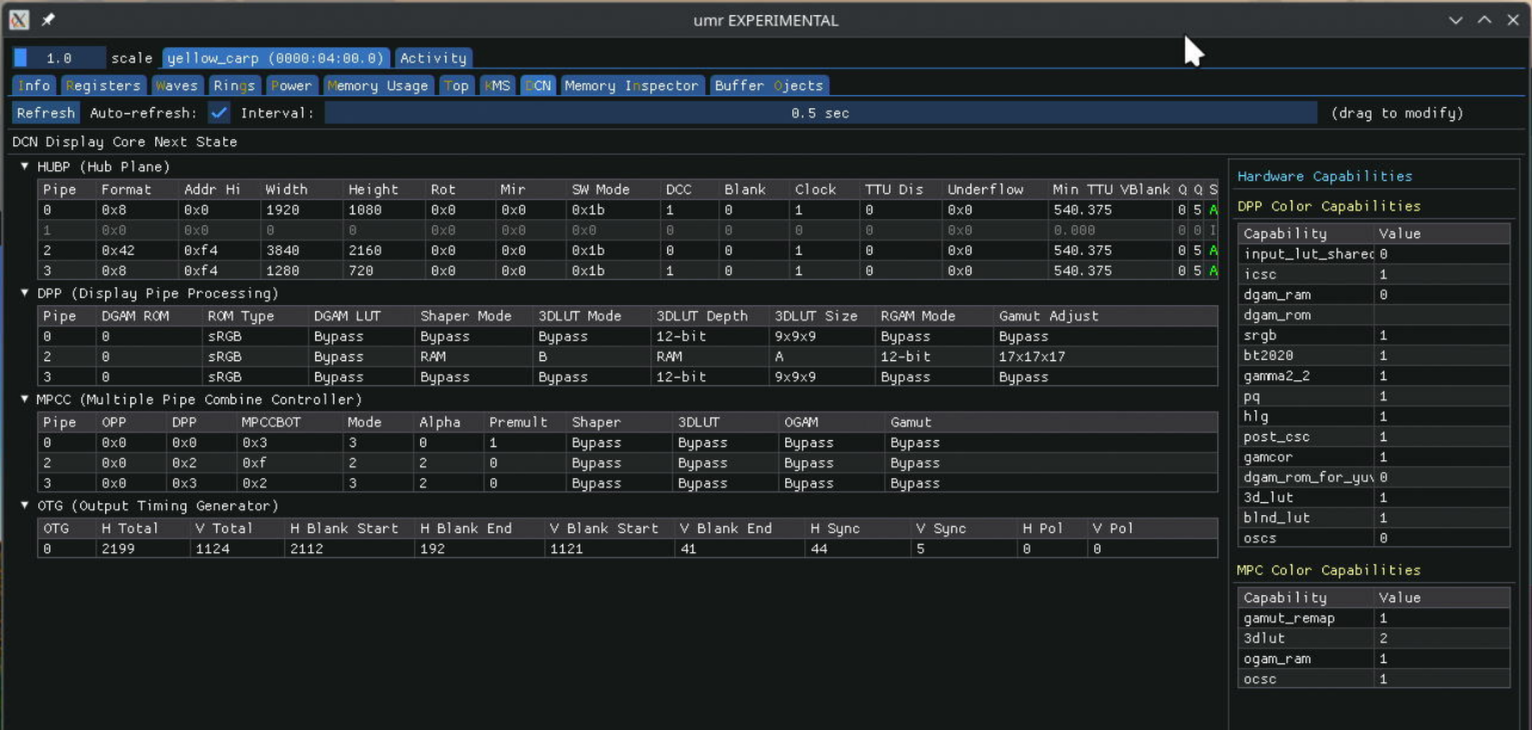
The code still needs a fair bit of work as this was the first time I used Claude for something extensive like this. I plan to post it eventually.
I used Claude Sonnet extensively for this work (it basically wrote all the code), so I thought it prudent to leave a couple thoughts on it.
LLMs are large language models, not actual artificial intelligence. They’re language models, and are designed to work well with language. They’re large and can hold much more context than humans. Use them in ways that uses their strength. I’ve found value in understanding complex code-bases, and creating code that fits within those code-bases.
Don’t stop owning your code. Even if it’s produced by an LLM, take pride and ownership. This means, review what you get from an LLM. Be active in steering it. Don’t throw trash at maintainers. Your name and reputation are on the line.
I’ll be working with relevant communities and maintainers to attempt to upstream these things.
The CSC colorop is probably in a good shape.
The KWin code requires feedback from maintainers. I expect it will need more work.
This also needs more testing. At times I see the 3D LUT fail to apply. I’m not sure whether this is a problem with my kwin code or amdgpu.
I don’t see offload candidate surfaces from many applications where I’d expect to see them. This needs further analysis. For one, I’m unsure what happens with games. The other thing is Youtube in Firefox, which fails to present the video as an offload surface. Some other videos work fine in Firefox, in particular local video playback.
sneaky edit: and power measurements, of course, since that’s the entire reason for this.
Hi all!
Lars has contributed an implementation independent test suite for the scfg configuration file format. This is quite nice for implementors, they get a base test suite for free. I’ve added support for it for libscfg, the C implementation.
I’ve spent some time working on the go-proxyproto library. While adding
support for PP2_SUBTYPE_SSL_CLIENT_CERT (a PROXY protocol addition to carry
the TLS client certificate I’ve introduced last month), I’ve fixed large PROXY
protocol headers being rejected (TLS certificates can be a few kilobytes), I’ve
fixed some issues in the test suite, and I’ve improved the HTTP/2 helper. I’ve
merged support for PP2_SUBTYPE_SSL_CLIENT_CERT in tlstunnel, soju and
kimchi.
Speaking about soju, delthas and taiite have finished up soju.im/client-cert,
a new IRC extension to manage TLS client certificates. Clients can register,
unregister, and list TLS client certificates which can be used for
authentication for the logged in user. We aim to stop storing plaintext
passwords, instead generating a fresh TLS certificate when logging in for the
first time and storing its key. Nobody has started working on a Goguma patch
yet, but that would be nice!
Goguma now has a brand new shiny website! Many thanks to Jean
THOMAS for building it from the ground up. delthas has added a /invite
command, I’ve added support for removing reactions (via the new unreact
message tag), and I’ve experimented with a Web build of the app (just for fun,
with WebSockets connections instead of TCP).
kanshi v1.9 has been released. This new version is the first to leverage
vali for Varlink support. The new ...output directive can match any number
of outputs, a the new mode preferred output directive can be used to select
the mode marked as preferred by the kernel.
I’ve resumed work on oembed-proxy, a small server which generates oEmbed
previews for arbitrary URLs. It’s quite simple: send an HTTP request with a
URL, it replies with a JSON payload with metadata such as page title, image
size, and so on. I plan to use it for IRC clients, to show link previews
without leaking the client’s IP address and to make them work on Web clients.
I’ve added support for Open Graph, the most widely used scheme to attach
structured data to Web pages. I ended up linking with ffmpeg because I figured
I would need to eventually generate thumbnails for images and videos. I played
a bit with CGo to integrate Go’s streaming io.Reader with ffmpeg’s C API. I
had to jump through a few hoops, but it works!
Hiroaki Yamamoto has contributed wlroots support for ext-workspace-v1, and Félix Poisot has upgraded color-management-v1 to minor version 2. Félix also uncovered some holes in our explicit synchronization implementation — we’re in the process of fixing these up now. I’ve started the wlroots release candidate cycle, and I just published RC3 today.
I’ve spent quite some time improving go-kdfs, a Go library for the Khronos
Data Format Specification. KDFS defines a standard file format to describe
how pixels are laid out in memory and how their contents should be interpreted.
I’ve added a bunch of new pixel formats, JSON output for the CLI, unit tests
against dfdutils, and a lot of other smaller improvements. I’ve written a
wlroots patch to remove a bunch of manually written pixel format
tables an replace them with auto-generated tables from go-kdfs. I’ve also added
sample position to pixfmtdb, a Web frontend for go-kdfs (see for instance the
Y samples on the DRM_FORMAT_NV12 page). Next up, I’d like to add missing
features to the kdfs compat command so that wlroots can get rid of all of its
tables (better endianness support, and flags to specify/strip some information
such as the alpha channel, color primaries or transfer function).
I’m quite happy with all of the good stuff we’ve managed to get over the fence this month! See you in March!
This is the start of a series about getting OpenGL ES 3.0 conformance on Vivante GC7000 hardware using the open-source etnaviv driver in Mesa. Thanks to Igalia for giving me the opportunity to spend some time on these topics.
etnaviv has supported GLES2 on Vivante GPUs for a long time. GLES3 support has been progressing steadily, but the remaining dEQP failures are the stubborn ones - the cases where the hardware doesn’t quite do what the spec says, and the driver has to get creative.
These aren’t missing feature bits or unimplemented extensions. These are the problems where you stare at a command stream trace from the proprietary blob driver and realize they’re doing something completely different from what you’d expect, because the hardware has a quirk that nobody documented.
My workflow for each fix follows a pattern:
The blob traces are invaluable. Vivante’s proprietary driver has years of hardware workarounds baked in. When something doesn’t work, the answer is usually hiding in the trace.
The primary test target is a GC7000 rev 6214 (HALTI5 generation). This is a capable GPU found in the NXP i.MX8MQ SoC. It has a BLT engine, texture descriptors, and most of the features needed for GLES3 - but also its own set of rasterization quirks and interpolation behaviors that need workarounds.
In the future, I plan to expand the focus to the broader GC7000 GPU family.
The first post will tackle the R/B swap problem - the PE always writes pixels in BGRA byte order, and we’ve been fixing it in the shader. The blob has a simpler answer. Stay tuned.
All of this work happens upstream in Mesa.
If you’re interested in GPU driver development, these posts aim to show what the work actually looks like – not just the final patch, but the debugging, the trace analysis, and the reasoning that gets you there.
This topic came up at kernel maintainers summit and some other groups have been playing around with it, particularly the BPF folks, and Chris Mason's work on kernel review prompts[1] for regressions. Red Hat have asked engineers to investigate some workflow enhancements with AI tooling, so I decided to let the vibecoding off the leash.
My main goal:
- Provide AI led patch review for drm patches
- Don't pollute the mailing list with them at least initially.
This led me to wanting to use lei/b4 tools, and public-inbox. If I could push the patches with message-ids and the review reply to a public-inbox I could just publish that and point people at it, and they could consume it using lei into their favorite mbox or browse it on the web.
I got claude to run with this idea, and it produced a project [2] that I've been refining for a couple of days.
I started with trying to use Chris' prompts, but screwed that up a bit due to sandboxing, but then I started iterating on using them and diverged.
The prompts are very directed at regression testing and single patch review, the patches get applied one-by-one to the tree, and the top patch gets the exhaustive regression testing. I realised I probably can't afford this, but it's also not exactly what I want.
I wanted a review of the overall series, but also a deeper per-patch review. I didn't really want to have to apply them to a tree, as drm patches are often difficult to figure out the base tree for them. I did want to give claude access to a drm-next tree so it could try apply patches, and if it worked it might increase the review, but if not it would fallback to just using the tree as a reference.
Some holes claude fell into, claude when run in batch mode has limits on turns it can take (opening patch files and opening kernel files for reference etc), giving it a large context can sometimes not leave it enough space to finish reviews on large patch series. It tried to inline patches into the prompt before I pointed out that would be bad, it tried to use the review instructions and open a lot of drm files, which ran out of turns. In the end I asked it to summarise the review prompts with some drm specific bits, and produce a working prompt. I'm sure there is plenty of tuning left to do with it.
Anyways I'm having my local claude run the poll loop every so often and processing new patches from the list. The results end up in the public-inbox[3], thanks to Benjamin Tissoires for setting up the git to public-inbox webhook.
I'd like for patch submitters to use this for some initial feedback, but it's also something that you should feel free to ignore, but I think if we find regressions in the reviews and they've been ignored, then I'll started suggesting it stronger. I don't expect reviewers to review it unless they want to. It was also suggested that perhaps I could fold in review replies as they happen into another review, and this might have some value, but I haven't written it yet. If on the initial review of a patch there is replies it will parse them, but won't do it later.
[1] https://github.com/masoncl/review-prompts
[2] https://gitlab.freedesktop.org/airlied/patch-reviewer
[3] https://lore.gitlab.freedesktop.org/drm-ai-reviews/
After years of working on etnaviv - a Gallium/OpenGL driver for Vivante GPUs - I’ve been wanting to get into Vulkan. As part of my work at Igalia, the goal was to bring VK_EXT_blend_operation_advanced to lavapipe. But rather than going straight there, I started with Honeykrisp - the Vulkan driver for Apple Silicon - as a first target: a real hardware driver to validate the implementation against before wiring it up in a software renderer. My first Vulkan extension, and my first real contribution to Honeykrisp.
A customer needed advanced blending support in lavapipe, so the extension choice was made for me. But it turned out to be a great fit for a first extension - useful, self-contained, and not a multi-month rabbit hole. Standard Vulkan blending is limited to basic operations like add and subtract with blend factors. That’s fine for most rendering, but if you want Photoshop-style effects - multiply, screen, overlay, color dodge, color burn - you’re stuck doing it manually in shaders or with extra render passes.
The extension adds 19 blend operations that handle all of this in the fixed-function pipeline. Useful for UI toolkits, image editors, and anywhere you need creative compositing.
What started as “just wire up an extension” turned into a proper refactoring adventure. The existing blend infrastructure in Mesa was scattered - OpenGL had its own enum definitions, Vulkan had separate conversions, and the actual NIR blend math lived in glsl-specific code.
So I took a step back and cleaned things up. Moved the blend mode enums into a shared util/blend.h header. Added proper helpers in the Vulkan runtime for converting between API types. Then came the fun part: implementing the actual blend equations in nir/lower_blend.
Each of those 19 blend modes has its own formula from the spec. Some are simple (multiply is just src * dst), others get hairy with conditionals and special cases for luminosity and saturation. About 570 lines of NIR code later, I had a lowering pass that any Mesa driver can use.
For example, here’s how the spec defines advanced blending. Each mode plugs into a general equation:
RGB = f(Cs,Cd) * X * p0 + Cs * Y * p1 + Cd * Z * p2
A   =            X * p0 +      Y * p1 +      Z * p2
Where p0, p1, p2 are weighting factors based on source/destination alpha coverage, and f(Cs,Cd) is the per-mode blend function. For overlay - probably the most recognizable blend mode from Photoshop - the spec defines:
f(Cs,Cd) = 2*Cs*Cd,              if Cd <= 0.5
           1 - 2*(1-Cs)*(1-Cd),  otherwise
And here’s that same formula expressed as NIR - Mesa’s intermediate representation:
static inline nir_def *
blend_overlay(nir_builder *b, nir_def *src, nir_def *dst)
{
   /* f(Cs,Cd) = 2*Cs*Cd, if Cd <= 0.5
    *            1-2*(1-Cs)*(1-Cd), otherwise
    */
   nir_def *rule_1 = nir_fmul(b, nir_fmul(b, src, dst), imm3(b, 2.0));
   nir_def *rule_2 =
      nir_fsub(b, imm3(b, 1.0),
               nir_fmul(b, nir_fmul(b, nir_fsub(b, imm3(b, 1.0), src),
                                        nir_fsub(b, imm3(b, 1.0), dst)),
                         imm3(b, 2.0)));
   return nir_bcsel(b, nir_fge(b, imm3(b, 0.5f), dst), rule_1, rule_2);
}
nir_fmul, nir_fsub, nir_bcsel - multiply, subtract, conditional select. Each call builds a node in the shader’s IR graph. This is what “lowering” looks like: translating a high-level blend mode into operations the GPU’s shader core can execute. The outer framework - the p0/p1/p2 weighting - is handled by the caller; each blend function just implements its f(Cs,Cd).
Everything was working on Honeykrisp, tests were passing, life was good. Then the merge pipeline started failing - on Turnip (the Adreno Vulkan driver). Not my code, not my hardware, but my changes were breaking it.
I reached out for help, and Zan Dobersek stepped up. After some digging, he found the culprit: I was violating a subtle corner of the spec around attachmentCount. Turns out, when certain dynamic states are set and advancedBlendCoherentOperations isn’t enabled, attachmentCount gets ignored entirely. My state tracking code wasn’t accounting for that.
One fixup commit later, Turnip was happy again. This is the part they don’t tell you about Vulkan extensions - you’re not just implementing for your driver, you’re touching shared infrastructure that every driver depends on. And the Mesa CI will absolutely let you know if you break something.
One week later, lavapipe has it too. This was the original goal, and the shared infrastructure did exactly what it was supposed to - the lavapipe MR is mostly just flipping the extension on. The lowering pass, the enum plumbing, the runtime helpers - all reused as-is. The full dEQP-VK.pipeline.*.blend_operation_advanced.* test suite passes on both drivers.
Two drivers in two weeks. That’s what building the right abstractions gets you.
The shared NIR lowering pass is there for any Mesa Vulkan driver to use. If your hardware doesn’t have native advanced blending support, enabling the extension is now mostly plumbing. I’m curious to see if other drivers pick it up.
For me, this was a good first step into Vulkan - and into working on Honeykrisp. I’m looking forward to what comes next.
The Honeykrisp/NIR MR and the lavapipe MR are both merged if you want to look at the code. Thanks to Alyssa Rosenzweig for the review and guidance, and to Zan Dobersek for debugging the Turnip regression with me.
If you haven't heard of gastown it is my sincere pleasure to be the one to fix that. If you're like me and you have way more ideas than time or ability to type them, gastown is an absolute game changer. I haven't felt this jazzed about programming in decades, like, I'm using antiquated slang like "jazzed" without embarrassment.
Well. Not embarrassment about that.
I awoke to a polite note from a colleague saying I had apparently pushed a bunch of random branches to the upstream Mesa repo and are we sure I wasn't hacked. No, I wasn't, those branches were definitely things I was working on, but I had been working on them locally, nothing should have even been pushed to my personal gitlab repo. I was using gastown to do that work so obviously we start looking there...
Gastown is built on beads and beads is built on git. Every atom of work within a gastown has a bead, which means updates to those beads are absolutely critical, if they don't happen then the town chugs to a halt. Gastown is also built on claude, or whatever, but claude is what I was using. Not to pick on claude, here, just using it as a generic brand name, claude is too polite to be a robust tool, sometimes. It'll lose some critical bit of context and want to stop and ask for directions. For a coding assistant that's a great way to be; for a code factory it's less awesome. It is slightly comic to read how much of gastown is just different ways of exhorting a lilypond of claudes to please do their work, please.
In gastown you wrap an upstream project in a rig, and I'm an old so I have all my git clones of everything already in ~/git, so I had set up my rigs to use those as the local storage so I didn't have to wait for things to clone again. The town mayor or one of his underlings dispatches work to ephemeral claude instances by writing the orders down in a bead, the work happens in the worker instance's git worktree instance of the rig. I would use gastown for the automagic git worktree management alone, forget the rest of the automation.
But here's where the projectile weapon starts pointing towards the positive gradient of the ol' G field. One way to try to help when claude loses context is to put important orientation information into CLAUDE.md, and helpfully, the /init command will build that for you by inspecting the current project. So I ran that at the top level of my gastown so it, gastown, wouldn't have to keep parsing "gt --help" output just to rediscover how to update a bead, hopefully. In doing so, claude lifted that directive about bead updates being seriously no-kidding mandatory up to the top level.
From that point on, claude instances would interpret that directive to apply to the project in the rig! So now, work isn't done until the work-in-progress branch is pushed. Until it is pushed to origin. Which, too bad that you cloned it from https, I'm going to discover the ssh URL to your personal mesa repo from the local repo's git config and change the URL in the rig to use ssh, because I was told to resolve the push failure or else.
So, cautionary tale, right? Maybe determinism in your tools still has value. Maybe plaintext English isn't the best idea for a configuration language. Maybe agent prompts need to be extra careful about context. Maybe careful sandbox construction would mitigate that kind of escape. Maybe an open source agent would be more trustworthy in terms of configurable tool usage since you would actually be able to see and control the boundary instead of just trusting that there is a boundary at all.
Just to keep up some blogging content, I'll do where did I spend/waste time last couple of weeks.
I was working on two nouveau kernel bugs in parallel (in between whatever else I was doing).
Bug 1: Lyude, 2 or 3 weeks ago identified the RTX6000 Ada GPU wasn't resuming from suspend. I plugged in my one and indeed it wasn't. Turned out since we moved to 570 firmware, this has been broken. We started digging down various holes on what changed, sent NVIDIA debug traces to decode for us. NVIDIA identified that suspend was actually failing but the result wasn't getting propogated up. At least the opengpu driver was working properly.
I started writing patches for all the various differences between nouveau and opengpu in terms of what we send to the firmware, but none of them were making a difference.
I took a tangent, and decided to try and drop the latest 570.207 firmware into place instead of 570.144. NVIDIA have made attempts to keep the firmware in one stream more ABI stable. 570.207 failed to suspend, but for a different reason.
It turns out GSP RPC messages have two levels of sequence numbering, one on the command queue, and one on the RPC. We weren't filling in the RPC one, and somewhere in the later 570's someone found a reason to care. Now it turned out whenever we boot on 570 firmware we get a bunch of async msgs from GSP, with the word ASSERT in them with no additional info. Looks like at least some of those messages were due to our missing sequence numbers and fixing that stopped those.
And then? still didn't suspend/resume. Dug into memory allocations, framebuffer suspend/resume allocations. Until Milos on discord said you did confirm the INTERNAL_FBSR_INIT packet is the same, and indeed it wasn't. There is a flag bEnteringGCOff, which you set if you are entering into graphics off suspend state, however for normal suspend/resume instead of runtime suspend/resume, we shouldn't tell the firmware we are going to gcoff for some reason. Fixing that fixed suspend/resume.
While I was head down on fixing this, the bug trickled up into a few other places and I had complaints from a laptop vendor and RH internal QA all lined up when I found the fix. The fix is now in drm-misc-fixes.
Bug 2: A while ago Mary, a nouveau developer, enabled larger pages support in the kernel/mesa for nouveau/nvk. This enables a number of cool things like compression and gives good speedups for games. However Mel, another nvk developer reported random page faults running Vulkan CTS with large pages enabled. Mary produced a workaround which would have violated some locking rules, but showed that there was some race in the page table reference counting.
NVIDIA GPUs post pascal, have a concept of a dual page table. At the 64k level you can have two tables, one with 64K entries, and one with 4K entries, and the addresses of both are put in the page directory. The hardware then uses the state of entries in the 64k pages to decide what to do with the 4k entries. nouveau creates these 4k/64k tables dynamically and reference counts them. However the nouveau code was written pre VMBIND, and fully expected the operation ordering to be reference/map/unmap/unreference, and we would always do a complete cycle on 4k before moving to 64k and vice versa. However VMBIND means we delay unrefs to a safe place, which might be after refs happen. Fun things like ref 4k, map 4k, unmap 4k, ref 64k, map 64k, unref 4k, unmap 64k, unref 64k can happen, and the code just wasn't ready to handle those. Unref on 4k would sometimes overwrite the entry in the 64k table to invalid, even when it was valid. This took a lot of thought and 5 or 6 iterations on ideas before we stopped seeing fails. In the end the main things were to reference count the 4k/64k ref/unref separately, but also the last thing to do a map operation owned the 64k entry, which should conform to how userspace uses this interface.
The fixes for this are now in drm-misc-next-fixes.
Thanks to everyone who helped, Lyude/Milos on the suspend/resume, Mary/Mel on the page tables.
Mesa 26.0 is big for RADV’s ray tracing. In fact, it’s so big it single-handedly revived this blog.
There are a lot of improvements to talk about, and some of them were in the making for a little over two years at this point.
In this blog post I’ll focus on the things I myself worked on specifically, most of which revolve around how ray tracing pipelines are compiled and dispatched. Of course, there’s more than just what I did myself: Konstantin Seurer worked on a lot of very cool improvements to how we build BVHs, the data structure that RT hardware uses for the triangle soup making up the geometry in game scenes so the HW can trace rays against them efficiently.
The rest of this blog post will assume some basic idea of how GPU ray tracing and ray tracing pipelines work. I’ve written about this in more detail one-and-a-half years ago, in my blog post about RT pipeline being enabled by default.
Let’s take a bit of a closer look at what I said about RT pipelines in RADV back then. In a footnote, I said:
Any-hit and Intersection shaders are still combined into a single traversal shader. This still shows some of the disadvantages of the combined shader method, but generally compile times aren’t that ludicrous anymore.
I spent a significant amount of time in that blogpost detailing about how there tend to be a really large number of shaders, and combining them into a single megashader is very slow because shader sizes get genuinely ridiculous at that point.
So clearly, it was only a matter of time until the any-hit/intersection shader combination would blow up spectacularly on a spectacular number of shaders, as well.
For illustrating the issues with inlined any-hit/intersection shaders, I’ll use Unreal Engine as an example because I noticed it being particularly egregious here. This definitely was an issue with other RT games/workloads as well, and function calls will provide improvements there too.
There’s a lot of people going around making fun of Unreal Engine these days, to the point of entire social media presences being built around mocking the ways in which UE is inefficient, slow, badly-designed bloatware and whatnot. Unfortunately, the most popular critics often know the least what they’re actually talking about. I feel compelled to point out here that while there certainly are reasonable complaints to be raised about UE and games made with it, I explicitly don’t want this section (or anything else in this post, really) to be misconstrued as “UE doing a bad thing”. As you’ll see, Unreal is really just using the RT pipeline API as designed.
With the disclaimer aside, what does Unreal actually do here that made RADV fall over so hard?
Let’s talk a bit about how big game engines handle shading and materials. As you’ll probably know already, to calculate how lighting interacts with objects in a scene, an application will usually run small programs called “shaders” on the GPU that, among other things1, calculate the colors different pixels have according to the material at that pixel.
Different materials interact with light differently, and in a large world with tons of different materials, you might end up having a ton of different shaders.
In a traditional raster setup you draw each object separately, so you can compile a lot of graphics pipelines for all of your materials, and then bind the correct one whenever you draw something with that material.
However, this approach falls apart in ray tracing. Rays can shoot through the scene randomly and they can hit pretty much any object that’s loaded in at the moment. You can only ever use one ray tracing pipeline at once, so every single material that exists in your scene and may be hit by a ray needs to be present in the RT pipeline. The more materials a game has, the more ludicrous the number of shaders gets.
Usually, this is most relevant for closest-hit shaders, because these are the shaders that get called for the object hit by the ray (where shading needs to be calculated). However, depending on your material setup, you may have something like translucent materials - where parts of the material are “see-through”, and rays should go through these parts to reveal the scene behind it instead of stopping.
This is where any-hit shaders come into play - any-hit shaders can instruct the driver to ignore a ray hitting a geometry, and instead keep searching for the next hit. If you have a ton of (potentially) translucent materials, that would translate into a lot of any-hit shaders being compiled for these materials.
The design of RT pipelines is quite obviously written in a way that accounts for this. In the previous blogpost I already mentioned pipeline libraries - the idea is that a material could just be contained in a “library”, and if RT pipelines want to use it, they just need to link to the library instead of compiling the shading code all over again. This also allows for easy addition/removal of materials: Even though you have to re-create the RT pipeline, all you need to do is link to the already compiled libraries for the different materials.
UE, particularly UE4, is a heavy user of libraries, which makes a lot of sense: It maps very well to what it’s trying to achieve. Everything’s good, as long as the driver doesn’t do silly things.
Silly things like, for example, combining any-hit shaders into one big traversal shader.
Doing something like that pretty much entirely side-steps the point of libraries. The traversal shader can only be compiled when all any-hit shaders are known, which is only at the very final linking step, which is supposed to be very fast…
And if UE4, assuming the linking step is very fast, does that re-linking over and over, very often, what you end up with is horrible pipeline compilation stutter every few seconds. And in this case, it’s not really UE’s fault, even! Sorry for that, Unreal.
Clearly, inlining all the any-hit and intersection shaders won’t work. So why not just compile them separately?
To answer that, I’ll try to start with explaining some assumptions that lie at the base of RADV’s shader compilation. When ACO (and NIR, too) were written, shaders were usually incredibly simple. They had some control flow, ifs, loops and whatnot, but all the code that would ever execute was contained in one compact program executing top-to-bottom. This perfectly matched what graphics/compute shaders looked like in the APIs, and what the API does is what you want to optimize for.
Unfortunately, this means RADV’s shader compilation stack got hit extra hard by the paradigm shift introduced by RT pipelines. Dynamic linking of different programs, and calls across the dynamic link boundaries, is something common in CPU programming languages (C/C++, etc.), but Mesa never really had to deal with something like that before2.
One specific core assumption that prevents us from compiling any-hit/intersection shaders separately just like that is that every piece of code assumes it has exclusive and complete access to things like registers and other hardware resources. Comparing to CPU again, most of the program code is contained in some functions, and those functions will be called from somewhere else3. Those functions will have used CPU registers and stack memory and so on before, and code inside that function can’t write to just any CPU register, or any location on stack. Which registers are writable by a function and which ones must have their values preserved (so that the function callers can store values of their own there without them being overwritten) are governed by little specifications called “calling conventions”.
In Mesa, the shader compiler generally used to have no concept of calling conventions, or a concept of “calling” something, for that matter. There was no concept of a register having some value from a function caller and needing to be preserved - if a register exists, the shader might end up writing its own value to it. In cases of graphics/compute shaders, this wasn’t a problem - the registers only ever had random uninitialized values in them.
This has always been a problem for separately compiling shaders in RT pipelines, but we had a different solution: At every point a shader called another shader, we’d split the shader in half: One half containing everything before the call, and the other half containing everything after. Of course, sometimes the second half needed variables coming from the first half of the shader. All these variables would be stored to memory in the first half. Then, the first half ends, and execution jumps to the called shader. Once the end of the called shader is reached, execution returns to the second half.
This was good enough for things like calling into traceRay to trace a ray and execute all the associated closest hit/miss shaders. Usually, applications wouldn’t
have that many variables needing to be backed up to memory, and tracing a ray is supposed to be expensive.
But that concept completely breaks down when you apply it to any-hit shaders. At the point an any-hit shader is called, you’re right in the middle of ray traversal. Ray traversal has lots of internal state variables that you really want to keep in registers at all times. If you call an any-hit shader with this approach, you’d have to back up all of these state variables to memory and reload them back afterwards. Any-hit shaders are supposed to be relatively cheap and called potentially lots of times during traversal. All these memory stores and reloads you’d need to insert would completely ruin performance.
So, separately compiling any-shaders was an absolute no-go. At least, unless someone were to go off the deep end and change the entire compiler stack to fix the assumptions at their heart.
I went and changed more or less the entire compiler stack to fix these assumptions and introduce proper function calls.
The biggest part of this work by far were the absolute basics. How do we best teach the compiler that certain registers need to be preserved and are best left alone? How should the compiler figure out that something like a call instruction might randomly overwrite other registers? How do we represent a calling convention/ABI specification in the driver? All of these problems can be tackled with different approaches and at different stages of compilation, and nailing down a clean solution is pretty important in a rework as fundamental as this one.
I started out with applying function calls to the shaders that were already separately compiled - this means that the function call work itself didn’t improve performance by too much, but in retrospect I think it was a very good idea to make sure the baseline functionality is rock-solid before moving on to separately-compiling any-hit shaders.
Indeed, once I finally got around to adding the code that splits out any-hit/intersection shaders and use function calls for them, things worked nearly out of the box! I opened the associated merge request a bit over two weeks ago and got everything merged within a week. (Of course, I would never have gotten it in that fast without all the reviewers teaming up to get everything in ASAP! Big thank you to Daniel, Rhys and Konstantin)
In comparison, I started work on function calls in January of 2024 and got the initial code in a good enough shape to open a merge request in June that year, and the code only got merged on the same day I opened the above merge request, two years after starting the initial drafting (although to be fair, that merge request also had periods of being stalled due to personal reasons).
Function calls makes shader compilation work in arguably a much more straightforward way. For the most part, the shader just gets compiled like any other -
there’s no fancy splitting or anything going on. If a shader
calls another shader, like when executing traceRay, or when calling an any-hit shaders, a call instruction is generated. When the called shader finishes,
execution resumes after the call instruction.
All the magic happens in ACO, the compiler backend. I’ve documented the more technical design of how calls and ABIs are represented in
a docs article.
At first, call instructions in the NIR IR are translated to a p_call “pseudo” instruction. It’s not actually a hardware instruction, but serves as a
placeholder for the eventual jump to the callee. This instruction also carries information about which specific registers parameters will be stored in, and
which registers may be overwritten by the call instruction.
ACO’s compiler passes have special handling for calls wherever necessary: For example, passes analyzing how many registers are required in all the different parts of the code take special care to take into account that in call instructions, fewer registers may be available to store values in (because all other values are overwritten). ACO also has a spilling pass for moving register values to memory whenever the amount of used registers exceeds the available amount.
Another fundamental change is that function calls also introduce a call stack. In CPUs, this is no big deal - you have one stack pointer register, and it points to the stack region that your program uses. However, on GPUs, there isn’t just one stack - remember that GPUs are highly parallel, and every thread running on the GPU needs its own stack!
Luckily, this sounds worse at first than it actually is. In fact, the hardware already has facilities to help manage stacks. AMD GPUs ever since Vega4 have
the concept of “scratch memory” - a memory pool in VRAM where the hardware ensures that each thread has its own private “scratch region”. There are special
scratch_* memory instructions that load and store from this scratch area. Even though they’re also VRAM loads/stores, they don’t take any address, just an offset,
and for each thread return the value stored in that thread’s own scratch memory region.
In my blog post about RT pipeline being enabled by default I claimed AMD GPUs don’t implement a call stack.
This is actually misleading - the scratch memory functionality is all you need to implement a stack yourself. The “stack pointer” here is just the offset
you pass to the scratch_* memory instruction. Pushing to the stack increases the stack offset, and popping from it decreases the offset5.
Eventually, when it comes to converting a call to hardware instructions, all that is needed is to execute the s_swappc instruction. This instruction
automatically writes the address of the next instruction to a register before jumping to the called shader. When the called shader wants to return, it
merely needs to jump to the address stored in that register, and execution resumes from right after the call instruction.
Finally, any-hit separate compilation was a straightforward task as well - it was merely an issue of defining an ABI that made sure that a ton of registers stay preserved and the caller can stash its values there. In practice, all of the traversal state will be stashed in these preserved registers. No expensive spilling to memory needed, just a quick jump to the any-hit shader and back.
If you look at the merge request, the performance benefits seem pretty obvious.
Ghostwire Tokyo’s RT passes speed up by more than 2x, and of course pipeline compilation times improved massively.
The compilation time difference is quite easy to explain. Generally, compilers will perform a ton of analysis passes on shader code to find everything they can to optimize it to death. However, these analysis passes often require going over the same code more than once, e.g. after gathering more context elsewhere in the shader. This also means that a shader that doubles in size will take more than twice as long to compile. When inlining hundreds or thousands of shaders into one, that also means that shader’s compile time grows by a lot more than just a hundred or a thousand times.
Thus, if we reverse things and are suddenly able to stop inlining all the shaders into one, that scaling effect means all the shaders will take less total time to compile than the one big megashader. In practice, all modern games also offload shader compilation to multiple threads. If you can compile the any-hit shaders separately, the game can compile them all in parallel - this just isn’t possible with the single megashader which will always be compiled on a single thread.
In the runtime performance department, moving to just having a single call instruction instead of hundreds of shaders in one place means the loop has a much smaller code size. In a loop iteration where you don’t call any any-hit shaders, you would still need to jump over all of the code for those shaders, almost certainly causing instruction cache misses, stalls and so on.
Also, forcing any-hit/intersection shaders to be separate also means that any-hit/intersection shaders that consume tons of registers despite nearly never getting called won’t have any negative effects on ray traversal as a whole. ACO has heuristics on where to optimally insert memory stores in case something somewhere needs more registers than available. However, these heuristics may decide to insert memory stores inside the generic traversal loop, even if the problematic register usage only comes from a few rarely-called inlined shaders. These stores in the generic loop would now mean that the whole shader is slowed down in every case.
However, separate compilation doesn’t exclusively have advantages, either. In an inlined shader, the compiler is able to use the context surrounding the (now-inlined) shader to optimize the code itself. A separately-compiled shader needs to be able to get called from any imaginable context (as long as it conforms to ABI), and this inhibits optimization.
Another consideration is that the jump itself has a small cost (not as big as you’d think, but it does have a cost). RADV currently keeps inlining any-hit shaders as long as you don’t have too many of them, and as long as doing so wouldn’t inhibit the ability to compile the shaders in parallel.
I also openend a merge request that provided massive performance improvements to Lumen’s RT right before the branchpoint.
However, these improvements are completely unrelated to function calls. In fact, they’re a tiny bit embarrassing, because all that changed was that RADV doesn’t make the hardware do ridiculously inefficient things anymore.
Let’s talk about dispatching RT shaders. The Vulkan API provides a vkCmdTraceRaysKHR command that takes in the number of rays to dispatch for X, Y and Z
dimensions. Usually, compute dispatches are described in terms of how many thread groups to dispatch, but RT is special because one ray corresponds to one
thread. So here, we really get the dispatch sizes in threads, not groups.
By itself, that’s not an issue. In fact, AMD hardware has always been able to specify dispatch dimensions in threads instead of groups. In that case, the hardware takes the job of assembling just enough groups that hold the specified number of threads. The issue here comes from how we describe that group to the hardware. The workgroup size itself is also per-dimension, and the simplest case of 32x1x1 threads (i.e. a 1D workgroup) is actually not always the best.
Let’s consider a very common ray tracing use case: You might want to trace a ray for each pixel in a 1920x1080 image. That’s pretty easy, you just call
vkCmdTraceRaysKHR to dispatch 1920 rays in the X dimension and 1080 in the Y dimension.
When you dispatch a 32x1x1 workgroup, the coordinates for each thread in a workgroup look like this:
thread id |  0  |  1  |  2  | ... |  16  |  17  |...|  31  |
coord     |(0,0)|(1,0)|(2,0)| ... |(16,0)|(17,0)|...|(31,0)|
Or, if you consider how the thread IDs are laid out in the image:
-------------------
0 | 1 | 2 | 3 | ..
-------------------
That’s a straight line in image space. That’s not the best, because it means that the pixels will most likely cover different objects which may have very different trace characteristics. This means divergence during RT will be higher, which can make the overall process slower.
Let’s look instead what happens when you make the workgroup 2D, with a 8x4 size:
thread id |  0  |  1  |  2  | ... |  16  |  17  |...|  31  |
coord     |(0,0)|(1,0)|(2,0)| ... |(0,2) |(1,2) |...|(7,3) |
In image space:
-------------------
0 | 1 | 2 | 3 | ..
------------------
8 | 9 | 10| 11| ..
------------------
16| 17| 18| 19| ..
-------------------
That’s much better. Threads are now arranged in a little square, and these squares are much more likely to all cover the same objects, have similar RT characteristics, etc.
This is why RADV used 8x4 workgroups as well. Now let’s get to when this breaks down. What if the RT dispatch doesn’t actually have 2 dimensions? What if there are 1920 rays in the X dimension, but the Y dimension is just 1?
It turns out that the hardware can only run 8 threads in a single wavefront in this case. This is because the rest of the workgroup is out-of-bounds of the dispatch - it has a non-zero Y coordinate, but the size in the Y dimension is only 1, so it would exceed the dispatch bounds.
The hardware also can’t pull in threads from other workgroups, because one wavefront can only ever execute one workgroup. The end result is that the wave runs with only 8 out of 32 threads active - at 1/4 theoretical performance. For no real reason.
I actually had noticed this issue years ago (with UE4, ironically). Back then I worked around it by rearranging the game’s dispatch sizes into a 2D one behind its back, and recalculating a 1-dimensional dispatch ID inside the RT shader so the game doesn’t notice. That worked just fine… as long as we’re actually aware about the dispatch sizes.
UE5 doesn’t actually use vkCmdTraceRaysKHR. It uses vkCmdTraceRaysIndirectKHR, a variant of the command where the dispatch size is read from GPU memory, not
specified on the CPU. This command is really cool and allows for some and nifty GPU-driven rendering setups where you only dispatch as many rays as
you’re definitely going to trace (as determined by previous GPU commands). This command also rips a giant hole in the approach of rearranging dispatch sizes, because
we don’t even know the dispatch size before the dispatch is actually executed. That means the super simple workaround I built was never hit, and we had the same
embarrassingly inefficient RT performance as a few years ago all over again.
Obviously, if UE5 is too smart for your workaround, then the solution is to make an even smarter workaround. The ideal solution would work with a 1D thread ID (so that we don’t run into any more issues when there is a 1D dispatch, but if a 2D dispatch is detected, we turn that “line” of 1D IDs into a “square”. The whole idea about turning a linear coordinate into a square reminded me a lot of how Z-order curves work. In fact, the GPU arranges things like image data on a Z-order curve by interleaving the address bits from X and Y already, because nearby pixels are often accessed together and it’s better if they’re close to each other.
However, instead of interleaving a X and Y coordinate pair to make a linear memory address, we want the opposite: We have a linear dispatch ID, and we want to recover a 2D coordinate inside a square from it. That’s not too hard, you just do the opposite operation: Deinterleave the bits, where every odd/even bit of the dispatch ID forms the X/Y coordinate. As it turned out, you can actually do this entirely from inside the shader with just a few bit twiddling tricks, so this approach work for both indirect and direct (non-indirect) trace commands.
With that approach, dispatch IDs and coordinates look something like this:
thread id |  0  |  1  |  2  | ... |  16  |  17  |...|  31  |
coord     |(0,0)|(1,0)|(0,1)| ... |(4,0) |(5,0) |...|(7,3) |
In image space:
-------------------
0 | 1 | 4 | 5 | ..
------------------
2 | 3 | 6 | 7 | ..
------------------
8 | 9 | 12| 13| ..
-------------------
10| 11| 14| 15| ..
-------------------
Not only are the thread IDs now arranged in squares, the squares themselves get recursively subdivided into more squares! I think theoretically this should be a further improvement w.r.t divergence, but I don’t think it has resulted in measurable speedup in practice anywhere.
The most important thing, though, is that now UE5 RT doesn’t run 4x slower than it should. Oops.
The second most fun thing about function calls is that you can just jump to literally any program anywhere, provided the program doesn’t completely thrash your preserved registers and stack space.
The most fun thing about function calls is what happens when the program does just that.
I’m going to use this section to scream in the void about two very real function call bugs that were reported after I already merged the MR. This is not an exhaustive list, you can trust I’ve had much much more fun just like what I’ll be presenting here while I was testing and developing function calls.
On the scale of function call bugs, this one was rather tame, even. Having infinite loops isn’t the most optimal for hang debugging, but it does mean that you can use a tool like umr to sample
which wavefronts are active, and get some register dumps. The program counter will at least point to some instruction in the loop that it’s stuck in, and you can get yourself the disassembly
of the whole shader to try and figure out what’s going in the loop and why the exit conditions aren’t met.
The loop in Avowed was rather simple: It traced a ray in a loop, and when the loop counter was equal to an exit value, control flow would break out of the loop. The register dumps also immediately highlighted the loop exit counter being random garbage. So far so good.
During the traceRay call, the loop exit counter was backed up to the shader’s stack. Okay, so it’s pretty obvious that the stack got smashed somehow and that corrupted the loop exit counter.
What was not obvious, however, was what smashed the stack. Debugging this is generally a bit of an issue - GPUs are far, far away from tools like AddressSanitizer, especially at a compiler level. There are no tools that would help me catch a faulty access at runtime. All I could really do was look at all the shaders in that ray tracing pipeline (luckily that one didn’t have too many) and see if they somehow store to wrong stack locations.
All shaders in that pipeline were completely fine, though. I checked every single scratch instruction in every shader if the offsets were correct (luckily, the offsets are constants encoded in the disassembly, so this part was trivial). I also verified that the stack pointer was incremented by the correct values - everything was completely fine. No shader was smashing its callers’ stack.
I found the bug more or less by complete chance. The shader code was indeed completely correct, there were no miscompilations happening. Instead, the “scratch memory” area the HW allocated was smaller than what each thread actually used, because I forgot to multiply by the number of threads in a wavefront in one place.
The stack wasn’t smashed by the called function, it was smashed by a completely different thread. Whether your stack would get smashed was essentially complete luck, depending on where the HW placed your scratch memory area, other wavefront’s scratch, and how those wavefronts’ execution was timed relative to yours. I don’t think I would ever have been able to deduce this from any debugger output, so I should probably count myself lucky I stumbled upon the fix regardless.
Did I talk about Unreal Engine yet? Let’s talk about Unreal Engine some more. Silent Hill 2 uses Lumen for its reflection/GI system, and somehow Lumen from UE 5.3 specifically was the only thing that seemed to reproduce this particular bug.
In every way the Avowed bug was tolerable to debug, this one was pure suffering. There were no GPU hangs, all shaders ran completely fine. That means using umr and getting
a rough idea of where the issue is was off the table from the start. Unfortunately, the RT pipeline was also way too large to analyze - there were a few hundred hit shaders,
but there also were seven completely different ray generation shaders.
Having little other recourse, I started trying to at least narrow down the ray generation shader that triggered the fault. I used Mesa’s debugging environment variables to
dump the SPIR-V of all the shaders the driver encountered, and then used spirv-cross on all of them to turn them into editable GLSL. For each ray generation shader, I’d
comment out the imageStore instructions that stored the RT result to some image, recompiled the modified GLSL to SPIR-V, and instructed Mesa to sneakily swap out the original
ray-gen SPIR-V with my modified one. Then I re-ran the game to see if anything changed.
This indeed led me to find the correct ray generation shader, but the lead turned into a dead end - there was little insight other than that the ray was indeed executing the miss shader. Everything seemed correct so far, and if I hadn’t known these rays didn’t miss about 3 commits ago, I honestly wouldn’t even have suspected anything was wrong at all.
The next thing I tried was commenting out random things in ray traversal code. Skipping over all any-hit/intersection shaders yielded no change, and neither did replacing the ray flags/culling masks with known good constants to rule out wrong values being passed as parameters. What did “fix” the result, however, was… commenting out the calls to closest-hit shaders.
Now, if closest-hit shaders get called and that makes miss shaders execute somehow, you’d perhaps think we’d be calling the wrong function. Maybe we confuse the shader binding table where we load the addresses of shaders to call from? To verify that assumption, I also disabled calling any and all miss shaders. I zeroed out the addresses in the shader handles to make extra sure there was no possible way that a miss shader could ever get called. To keep things working, I replaced the code that calls miss shaders with the relevant code fragment from UE’s miss shader (essentially inlining the shader myself).
Nothing changed from that. That means a closest-hit shader being executed somehow resulted in a ray traversal itself returning a miss, not the wrong function being called.
Perhaps the closest-hit shaders corrupt some caller values again? Since the RT pipeline was too big to analyze, I tried to narrow down the suspicious shaders by only disabling specific closest-hit shaders. I also discovered that just making all closest-hit shaders no-ops “fixed” things as well, even if they do get called.
Sure enough, at some point I had a specific closest-hit shader where the issue went away once I deleted all code from it/made it a no-op. I even figured out a specific register that, if explicitly preserved, would make the issue go away.
The only problem was that this register corresponded to one part of the return value of the closest-hit shader - that is, a register that the shader was supposed to overwrite.
From here on out it gets completely nonsensical. I will save you the multiple days of confusion, hair-pulling, desperation and agony over the complete and utter undebuggableness of Lumen’s RT setup and skip to the solution:
It turned out the “faulty” closest-hit shader I found was nothing but a red herring. Lumen’s RT consists of 6+ RT dispatches, most of which I haven’t exactly figured out the purpose of, but what
I seemed to observe was that the faulty RT dispatch used the results of the previous RT dispatch to make decisions on whether to trace any rays or not. Making the closest-hit shaders a no-op
did nothing but disable the subsequent traceRays that actually exhibited the issue.
Since these RT dispatches used the same RT pipelines, that meant virtually any avenue I had of debugging this driver-side was completely meaningless. Any hacks inside the shader compiler might actually work around the issue, or just affect a conceptually unrelated dispatch that happens to disable the actually problematic rays. Determining which was the case was nearly impossible, especially in a general case.
I never really figured out how to debug this issue. Once again, what saved me was a random epiphany out of the blue. In fact, now that I know what the bug was, I’m convinced I would’ve never found this through a debugger either.
The issue turned out to be in an optimization for what’s commonly called tail-calls. If you have a function that calls another function at the very end just before returning, a common optimization is to simply turn that call into a jump, and let the other function return directly to the caller.
Imagine ray traversal working a bit like this C code:
/* hitT is the t value of the ray at the hit point */
payload closestHit(float hitT);

/* tMax is the maximum range of the ray, if there is
 * no hit with a t <= tMax, the ray misses instead */
payload traversal(float tMax) {
   do something;
   if (hit)
       return closestHit(hitT); // gets replaced with a jmp, closestHit returns directly to traversal's caller
}
More specifically, the bug was with how preserved parameters and tail-calls interact. Function callers are generally supposed to assume that preserved parameters do not change their value over the function call. That means it’s safe to reuse that register after the call and assuming it still has the value the caller put in.
However, in the example above, let’s assume closestHit has the same calling convention as traversal. That means closestHit’s parameter needs to go into the same register as traversal’s parameter, and thus the register
gets overwritten.
If traversal’s caller was assuming that the parameter is preserved, that would mean the value of tMax has just been overwritten with the value of hitT without the caller knowing.
If traversal now gets called again from the same place, the value of tMax is not the intended value, but the hitT value from the previous iteration, which is definitely smaller than tMax.
Put shortly: If all these conditions are met, a smaller-than-intended tMax could cause rays to miss when they were intended to hit.
Once again, I got incredibly lucky and stumbled upon the bug by complete chance.
The GPU gods seem to be in good spirits for my endeavours. I pray it stays this way.
“Shader” in this context really means any program that runs on the GPU. The RT pipeline is also made of shaders, shaders determine where the points and triangles making up each object end up on screen, there are compute shaders for generic computing, and so on… ↩
There actually is another use-case where this becomes relevant on GPU - and that is GPGPU code like CUDA/HIP/OpenCL. CUDA/HIP allow you to write C++ for the GPU in a much more “CPU-like” programming environment (OpenCL uses C), and you run into all the same problems there. This also means all the major GPU vendors had already written their solutions for these problems when raytracing came around. There are OpenCL kernels that end up really really bad if you don’t have proper function calls in the compiler (which Rusticl suffers from right now), and the function calls work in RADV/ACO may end up proving useful for those as well. ↩
Even your main function works like that, actually. Unless you have some form of freestanding environment, all your program code works like that. ↩
In RADV, the stack pointer is actually constant across a function, and pushing/popping to/from the stack is implemented by adding another offset to the constant stack pointer in load/store instructions. This allows to make the stack pointer an SGPR instead of a VGPR and simplifies stack accesses that aren’t push/pop. ↩
We support raytracing before Vega too. We support function calls on all GPUs, as well, through a little magic in dreaming up a buffer descriptor with specific memory swizzling to achieve the same addressing that scratch_* instructions use on Vega and later. ↩
Today, we announce Amutable, our ✨ new ✨ company. We – @blixtra@hachyderm.io, @brauner@mastodon.social, @davidstrauss@mastodon.social, @rodrigo_rata@mastodon.social, @michaelvogt@mastodon.social, @pothos@fosstodon.org, @zbyszek@fosstodon.org, @daandemeyer@mastodon.social @cyphar@mastodon.social, @jrocha@floss.social and yours truly – are building the 🚀 next generation of Linux systems, with integrity, determinism, and verification – every step of the way.
For more information see → https://amutable.com/blog/introducing-amutable
Today is a big day for graphics. We got shiny new extensions and a new RM2026 profile, huzzah.
VK_EXT_descriptor_heap is huge. I mean in terms of surface area, the sheer girth of the spec, and the number of years it’s been under development. Seriously, check out that contributor list. Is it the longest ever? I’m not about to do comparisons, but it might be.
So this is a big deal, and everyone is out in the streets (I assume to celebrate such a monumental leap forward), and I’m not.
All hats off. Person to person, let’s talk.
It’s true that descriptor heap is incredibly powerful. It perfectly exemplifies everything that Vulkan is: low-level, verbose, flexible. vkd3d-proton will make good use of it (eventually), as this more closely relates to the DX12 mechanics it translates. Game engines will finally have something that allows them to footgun as hard as they deserve. This functionality even maps more closely to certain types of hardware, as described by a great gfxstrand blog post.
There is, to my knowledge, just about nothing you can’t do with VK_EXT_descriptor_heap. It’s really, really good, and I’m proud of what the Vulkan WG has accomplished here.
But I don’t like it.
It’s a risky position; I don’t want anyone’s takeaway to be “Mike shoots down new descriptor extension as worst idea in history”. We’re all smart people, and we can comprehend nuance, like the difference between rb and ab in EGL patch review (protip: if anyone ever gives you an rb, they’re fucking lying because nobody can fully comprehend that code).
In short, I don’t expect zink to ever move to descriptor heap. If it does, it’ll be years from now as a result of taking on some other even more amazing extension which depends on heaps. Why is this, I’m sure you ask. Well, there’s a few reasons:
Like all things Vulkan, “getting it right” with descriptors meant creating an API so verbose that I could write novels with fewer characters than some of the struct names. Everything is brand new, with no sharing/reuse of any existing code. As anyone who has ever stepped into an unfamiliar bit of code and thought “this is garbage, I should rewrite it all” knows too well, existing code is always the worst code–but it’s also the code that works and is tied into all the other existing code. Pretty soon, attempting to parachute in a new descriptor API becomes rewriting literally everything because it’s all incompatible. Great for those with time and resources to spare, not so great for everyone else.
Gone are image views, which is cool and good, except that everything else in Vulkan still uses them, meaning now all image descriptors need an extra pile of code to initialize the new structs which are used only for heaps. Hope none of that was shared between rendering and descriptor use, because now there will be rendering use and descriptor use and they are completely separate. Do I hate image views? Undoubtedly, and I like this direction, but hit me up in a few more years when I can delete them everywhere.
Shader interfaces are going to be the source of most pain. Sure, it’s very possible to keep existing shader infrastructure and use the mapping API with its glorious nested structs. But now you have an extra 1000 lines of mapping API structs to juggle on top. Alternatively, you can get AI to rewrite all your shaders to use the new spirv extension and have direct heap access.
Descriptor heap maps closer to hardware, which should enable users to get more performant execution by eliminating indirection with direct heap access. This is great. Full stop.
…Unless you’re like zink, where the only way to avoid shredding 47 CPUs every time you change descriptors is to use a “sliding” offset for descriptors and update it each draw (i.e., VK_DESCRIPTOR_MAPPING_SOURCE_HEAP_WITH_PUSH_INDEX_EXT). Then you can’t use direct heap access. Which means you’re still indirecting your descriptor access (which has always been the purported perf pain point of 1.0 descriptors and EXT_descriptor_buffer). You do not pass Go, you do not collect $200. All you do is write a ton of new code.
There’s a tremendous piece of exposition outlining the reasons why EXT_descriptor_heap exists in the proposal. None of these items are incorrect. I’ve even contributed to this document. If I were writing an engine from scratch, I would certainly expect to use heaps for portability reasons (i.e., in theory, it should eventually be available on all hardware).
But as flexible and powerful as descriptor heap is, there are some annoying cases where it passes the buck to the user. Specifically, I’m talking about management of the sampler heap. 1.0 descriptors and descriptor buffer just handwave away the exact hardware details, but with VK_EXT_descriptor_heap, you are now the captain of your own destiny and also the manager of exactly how the hardware is allocating its samplers. So if you’re on NVIDIA, where you have exactly 4096 available samplers as a hardware limit, you now have to juggle that limit yourself instead of letting the driver handle it for you.
This also applies to border colors, which has its own note in the proposal. At an objective, high-view level, it’s awesome to have such fine-grained control over the hardware. Then again, it’s one more thing the driver is no longer managing.
That’s certainly the takeaway here. I’m not saying go back to 1.0 descriptors. Nobody should do that. I’m not saying stick with descriptor buffers either. Descriptor heap has been under development since before I could legally drive, and I’m certainly not smarter than everyone (or anyone, most likely) who worked on it.
Maybe this is the best we’ll get. Maybe the future of descriptors really is micromanaging every byte of device memory and material stored within because we haven’t read every blog post in existence and don’t trust driver developers to make our shit run good. Maybe OpenGL, with its drivers that “just worked” under the hood (with the caveat that you, the developer, can’t be an idiot), wasn’t what we all wanted.
Maybe I was wrong, and we do need like five trillion more blog posts about Vulkan descriptor models. Because releasing a new descriptor extension is definitely how you get more of those blog posts.
Hi!
Last week I’ve released Goguma v0.9! This new version brings a lot of niceties, see the release notes for more details. New since last month are audio previews implemented by delthas, images for users, channels & networks, and usage hints when typing a command. Jean THOMAS has been hard at work to update the iOS port and publish Goguma on AltStore PAL.
It’s been a while since I’ve started a NPotM, but this time I have something new to show you: nagjo is a small IRC bot for Forgejo. It posts messages on activity in Forgejo (issue opened, pull request merged, commits pushed, and so on), and it expands references to issues and pull requests in messages (writing “can you look at #42?” will reply with the issue’s title and link). It’s very similar to glhf, its GitLab counterpart, but the configuration file enables much more flexible channel routing. I hope that bot can be useful to others too!
Up until now, many of my projects have moved to Codeberg from SourceHut, but the issue tracker was still stuck on todo.sr.ht due to a lack of a migration tool. I’ve hacked together srht2forgejo, a tiny script to create Forgejo issues and comments from a todo.sr.ht archive. It’s not perfect since the author is the migration user’s instead of the original one, but it’s good enough. I’ve now completely migrated all of my projects to Codeberg!
I’ve added a server implementation and tests to go-smee, a small Go library for a Web push forwarding service. It comes in handy when implementing Web push receivers because it’s very simple to set up, I’ve used it when working on nagjo.
I’ve extended the haproxy PROXY protocol to add a new client certificate TLV to relay the raw client certificate from a TLS terminating reverse proxy to a backend server. My goal is enabling client certificate authentication when the soju IRC bouncer sits behind tlstunnel. I’ve also sent patches for the kimchi HTTP server and go-proxyproto.
Because sending a haproxy patch involved git-send-email, I’ve noticed I’ve
started hitting a long-standing hydroxide signature bug when sending a
message. I wasn’t previously impacted by this, but some users were. It took a
bit of time to hunt down the root cause (some breaking changes in ProtonMail’s
crypto library), but now it’s fixed.
Félix Poisot has added two new color management options to Sway: the
color_profile command now has separate gamma22 and srgb transfer
functions (some monitors use one, some use the other), and a
--device-primaries flag to read color primaries from the EDID (as an
alternative to supplying a full ICC profile).
With the help of Alexander Orzechowski, we’ve fixed multiple wlroots issues regarding toplevel capture (aka. window capture) when the toplevel is completely hidden. It should all work fine now, except one last bug which results in a frozen capture if you’re unlucky (aka. you loose the race).
I’ve shipped a number of drmdb improvements. Plane color pipelines are now
supported and printed on the snapshot tree and properties table. A warning icon
is displayed next to properties which have only been observed on tainted or
unstable kernels (as is usually the case for proprietary or vendor kernel
modules with custom properties). The device list now shows vendor names for
platform devices (extracted from the kernel table). Devices using the new
“faux” bus (e.g. vkms) are now properly handled, and all of the possible cursor
sizes advertised via the SIZE_HINTS property are now printed. I’ve also done
some SQLite experiments, however they turned out unsuccessful (see that
thread and the merge request for more details).
delthas has added a new allow_proxy_ip directive to the kimchi
HTTP server to mark IP addresses as trusted proxies, and has made it so
Forwarded/X-Forwarded-For header fields are not overwritten when the
previous hop is a trusted proxy. That way, kimchi can be used in more scenario:
behind another HTTP reverse proxy, and behind a TCP proxy which doesn’t have a
loopback IP address (e.g. tlstunnel in Docker).
See you next month!
So one thing I think anyone involved with software development for the last decades can see is the problem of “forest of bogus patents”. I have recently been trying to use AI to look at patents in various ways. So one idea I had was “could AI help improve the quality of patents and free us from obvious ones?”
Lets start with the justification for patents existing at all. The most common argument for the patent system I hear is this one : “Patents require public disclosure of inventions in exchange for protection. Without patents, inventors would keep innovations as trade secrets, slowing overall technological progress.”. This reasoning is something that makes sense to me, but it is also screamingly obvious to me that for it to hold true you need to ensure the patents granted are genuinely inventions that otherwise would stay hidden as trade secrets. If you allow patents on things that are obvious to someone skilled in the art, you are not enhancing technological progress, you are hampering it because the next person along will be blocking from doing it.
So based on this justification the question then becomes does for example the US Patents Office do a good job filtering out obvious patents? And I believe the answer is “No they don’t”. Having been working in the space of software for many decades now it is very clear to me that the patent office do very little to avoid patents getting approved for obvious things. And there are many reasons for why that happens I think. First of all if you are an expert in a field you would likely not be working as a case worker in the patent office, no disrespect for the people working there, but for instance if you are a really good software engineer there are much better paying options to be found elsewhere, same goes for medical researchers for example. So we have people who have limited understanding of the field of the patent trying to evaluate if the patent is obvious or not.
Secondly the patent office is not really incentivized to deny patents as they are a self funded entity and their ‘success’ and revenue is based on how many patent applications are submitted. So the lower the bar of approval, the more patents applications get submitted and thus the patent office makes more money and is more “successful”. This is a problem, but maybe if we fix the first issue I mention it is maybe possible to reduce the impact of this second issue.
So what can AI do to help here? It can help patent reviewers at the patent office with evaluating patents for obviousness due to having been trained on these fields. If we required every patent applied for to be run through a AI engine for review then the patent office reviewer would have to justify why he or she believes something is non-obvious after the AI has looked at it and concluded it is not. My assumption would be that they would very rarely do so.
To test out this I decided to ask Gemini to review a H264 video patent that is still valid and which has been used in litigation before, to see if it could do a decent job of reviewing the patent application and judge if this is a true invention or not. Here is what Gemini came up with.
US Patent 7,916,782 (Samsung Electronics) is one of the most famous “battleground” patents in the history of smartphone litigation. It has been asserted against Apple, Huawei, and others.
It covers a specific part of the H.264 standard known as CAVLC (Context-Adaptive Variable Length Coding).
The Patent: US 7,916,782 : Method and apparatus for video coding and decoding The Mechanism: Efficiently coding the count of zero-valued pixels in a video block (“TotalZeros”).
The Problem
In video compression, you divide the image into small 4×4 pixel blocks. After processing (transform and quantization), most of the 16 pixels in the block end up being zero. You only have a few non-zero numbers left.
Goal: You need to tell the decoder how many zeros are in the block so it can reconstruct the empty space.
Constraint: You already told the decoder how many non-zero coefficients exist (let’s say you have 5 non-zeros).
The “Invention” The patent claims a method where the encoder selects a specific lookup table (VLC table) to encode the “TotalZeros” value, and—crucially—this selection is based on the number of non-zero coefficients (TotalCoeff) that were just processed. If TotalCoeff is 1, use Table A (allows for many zeros).If TotalCoeff is 10, use Table B (allows for fewer zeros).
The “Skilled Engineer” Test
Imagine you are a video coding engineer in 2002. You are tasked with compressing the “TotalZeros” value. Here is the logical deduction chain you would inevitably follow:
Engineer’s Thought: “I should use a smaller, custom table that only contains values 0 through 11.”
Engineer’s Thought: “Actually, I should just make a different table for every possible number of non-zeros. If I have 15 non-zeros, the only possible zero count is 1. I don’t even need a table for that; it’s implicit!”
The Verdict: Valid or Broken?
Engineer’s View (Obvious): This is not an invention; it is constraint propagation. If you have a container of capacity 16, and you fill it with 5 rocks, it is “obvious” that the remaining space for air is 11. Creating a table sized to “11” isn’t a creative spark; it is the mathematical consequence of the block size. To an engineer, failing to do this would be incompetence, not a design choice.
Patent Office View (Novel): The USPTO granted this because the patent didn’t just claim “optimizing tables.” It claimed the specific structure of the solution: Check TotalCoeff.If TotalCoeff is 1, select Table_1. If TotalCoeff is 2, select Table_2. …and so on. Because no prior paper had explicitly written down “Use these specific tables in this specific order for H.264,” it was deemed novel.
Conclusion US 7,916,782 is a prime example of the “broken” system because it effectively patents arithmetic efficiency. By granting a monopoly on the logic “Use a small table when you have small space,” the patent office allowed Samsung to assert ownership over the only logical way to implement the H.264 standard efficiently. An engineer trying to solve this problem without seeing the patent would essentially be forced to “re-invent” it, because the math leaves no other optimal path.
Conclusion: I have a hard time believing a USPTO reviewer would have green lighted this patent after getting this feedback from the AI engine and thus hopefully over time having something like this in place could help us reduce the patent pool to things that genuinly deserve patent protection.
For all the rightful criticisms that C gets, GLib does manage to alleviate at least some of it. If we can’t use a better language, we should at least make use of all the tools we have in C with GLib.
This post looks at the topic of ownership, and also how it applies to libdex fibers.
In normal C usage, it is often not obvious at all if an object that gets returned from a function (either as a real return value or as an out-parameter) is owned by the caller or the callee:
MyThing *thing = my_thing_new ();
If thing is owned by the caller, then the caller also has to release the object thing. If it is owned by the callee, then the lifetime of the object thing has to be checked against its usage.
At this point, the documentation is usually being consulted with the hope that the developer of my_thing_new documented it somehow. With gobject-introspection, this documentation is standardized and you can usually read one of these:
The caller of the function takes ownership of the data, and is responsible for freeing it.
The returned data is owned by the instance.
If thing is owned by the caller, the caller now has to release the object or transfer ownership to another place. In normal C usage, both of those are hard issues. For releasing the object, one of two techniques are usually employed:
MyThing *thing = my_thing_new ();
gboolean c;
c = my_thing_a (thing);
if (c)
  c = my_thing_b (thing);
if (c)
  my_thing_c (thing);
my_thing_release (thing); /* release thing */
  MyThing *thing = my_thing_new ();
  if (!my_thing_a (thing))
    goto out;
  if (!my_thing_b (thing))
    goto out;
  my_thing_c (thing);
out:
  my_thing_release (thing); /* release thing */
GLib provides automatic cleanup helpers (g_auto, g_autoptr, g_autofd, g_autolist). A macro associates the function to release the object with the type of the object (e.g. G_DEFINE_AUTOPTR_CLEANUP_FUNC). If they are being used, the single exit and goto cleanup approaches become unnecessary:
g_autoptr(MyThing) thing = my_thing_new ();
if (!my_thing_a (thing))
  return;
if (!my_thing_b (thing))
  return;
my_thing_c (thing);
The nice side effect of using automatic cleanup is that for a reader of the code, the g_auto helpers become a definite mark that the variable they are applied on own the object!
If we have a function which takes ownership over an object passed in (i.e. the called function will eventually release the resource itself) then in normal C usage this is indistinguishable from a function call which does not take ownership:
MyThing *thing = my_thing_new ();
my_thing_finish_thing (thing);
If my_thing_finish_thing takes ownership, then the code is correct, otherwise it leaks the object thing.
On the other hand, if automatic cleanup is used, there is only one correct way to handle either case.
A function call which does not take ownership is just a normal function call and the variable thing is not modified, so it keeps ownership:
g_autoptr(MyThing) thing = my_thing_new ();
my_thing_finish_thing (thing);
A function call which takes ownership on the other hand has to unset the variable thing to remove ownership from the variable and ensure the cleanup function is not called. This is done by “stealing” the object from the variable:
g_autoptr(MyThing) thing = my_thing_new ();
my_thing_finish_thing (g_steal_pointer (&thing));
By using g_steal_pointer and friends, the ownership transfer becomes obvious in the code, just like ownership of an object by a variable becomes obvious with g_autoptr.
Now you could argue that the g_autoptr and g_steal_pointer combination without any conditional early exit is functionally exactly the same as the example with the normal C usage, and you would be right. We also need more code and it adds a tiny bit of runtime overhead.
I would still argue that it helps readers of the code immensely which makes it an acceptable trade-off in almost all situations. As long as you haven’t profiled and determined the overhead to be problematic, you should always use g_auto and g_steal!
The way I like to look at g_auto and g_steal is that it is not only a mechanism to release objects and unset variables, but also annotations about the ownership and ownership transfers.
One pattern that is still somewhat pronounced in older code using GLib, is the declaration of all variables at the top of a function:
static void
foobar (void)
{
  MyThing *thing = NULL;
  size_t i;

  for (i = 0; i < len; i++) {
    g_clear_pointer (&thing);
    thing = my_thing_new (i);
    my_thing_bar (thing);
  }
}
We can still avoid mixing declarations and code, but we don’t have to do it at the granularity of a function, but of natural scopes:
static void
foobar (void)
{
  for (size_t i = 0; i < len; i++) {
    g_autoptr(MyThing) thing = NULL;

    thing = my_thing_new (i);
    my_thing_bar (thing);
  }
}
Similarly, we can introduce our own scopes which can be used to limit how long variables, and thus objects are alive:
static void
foobar (void)
{
  g_autoptr(MyOtherThing) other = NULL;

  {
    /* we only need `thing` to get `other` */
    g_autoptr(MyThing) thing = NULL;

    thing = my_thing_new ();
    other = my_thing_bar (thing);
  }

  my_other_thing_bar (other);
}
When somewhat complex asynchronous patterns are required in a piece of GLib software, it becomes extremely advantageous to use libdex and the system of fibers it provides. They allow writing what looks like synchronous code, which suspends on await points:
g_autoptr(MyThing) thing = NULL;

thing = dex_await_object (my_thing_new_future (), NULL);
If this piece of code doesn’t make much sense to you, I suggest reading the libdex Additional Documentation.
Unfortunately the await points can also be a bit of a pitfall: the call to dex_await is semantically like calling g_main_loop_run on the thread default main context. If you use an object which is not owned across an await point, the lifetime of that object becomes critical. Often the lifetime is bound to another object which you might not control in that particular function. In that case, the pointer can point to an already released object when dex_await returns:
static DexFuture *
foobar (gpointer user_data)
{
  /* foo is owned by the context, so we do not use an autoptr */
  MyFoo *foo = context_get_foo ();
  g_autoptr(MyOtherThing) other = NULL;
  g_autoptr(MyThing) thing = NULL;

  thing = my_thing_new ();
  /* side effect of running g_main_loop_run */
  other = dex_await_object (my_thing_bar (thing, foo), NULL);
  if (!other)
    return dex_future_new_false ();

  /* foo here is not owned, and depending on the lifetime
   * (context might recreate foo in some circumstances),
   * foo might point to an already released object
   */
  dex_await (my_other_thing_foo_bar (other, foo), NULL);
  return dex_future_new_true ();
}
If we assume that context_get_foo returns a different object when the main loop runs, the code above will not work.
The fix is simple: own the objects that are being used across await points, or re-acquire an object. The correct choice depends on what semantic is required.
We can also combine this with improved scoping to only keep the objects alive for as long as required. Unnecessarily keeping objects alive across await points can keep resource usage high and might have unintended consequences.
static DexFuture *
foobar (gpointer user_data)
{
  /* we now own foo */
  g_autoptr(MyFoo) foo = g_object_ref (context_get_foo ());
  g_autoptr(MyOtherThing) other = NULL;

  {
    g_autoptr(MyThing) thing = NULL;

    thing = my_thing_new ();
    /* side effect of running g_main_loop_run */
    other = dex_await_object (my_thing_bar (thing, foo), NULL);
    if (!other)
      return dex_future_new_false ();
  }

  /* we own foo, so this always points to a valid object */
  dex_await (my_other_thing_bar (other, foo), NULL);
  return dex_future_new_true ();
}
static DexFuture *
foobar (gpointer user_data)
{
  /* we now own foo */
  g_autoptr(MyOtherThing) other = NULL;

  {
    /* We do not own foo, but we only use it before an
     * await point.
     * The scope ensures it is not being used afterwards.
     */
    MyFoo *foo = context_get_foo ();
    g_autoptr(MyThing) thing = NULL;

    thing = my_thing_new ();
    /* side effect of running g_main_loop_run */
    other = dex_await_object (my_thing_bar (thing, foo), NULL);
    if (!other)
      return dex_future_new_false ();
  }

  {
    MyFoo *foo = context_get_foo ();

    dex_await (my_other_thing_bar (other, foo), NULL);
  }

  return dex_future_new_true ();
}
One of the scenarios where re-acquiring an object is necessary, are worker fibers which operate continuously, until the object gets disposed. Now, if this fiber owns the object (i.e. holds a reference to the object), it will never get disposed because the fiber would only finish when the reference it holds gets released, which doesn’t happen because it holds a reference. The naive code also suspiciously doesn’t have any exit condition.
static DexFuture *
foobar (gpointer user_data)
{
  g_autoptr(MyThing) self = g_object_ref (MY_THING (user_data));

  for (;;)
    {
      g_autoptr(GBytes) bytes = NULL;

      bytes = dex_await_boxed (my_other_thing_bar (other, foo), NULL);

      my_thing_write_bytes (self, bytes);
    }
}
So instead of owning the object, we need a way to re-acquire it. A weak-ref is perfect for this.
static DexFuture *
foobar (gpointer user_data)
{
  /* g_weak_ref_init in the caller somewhere */
  GWeakRef *self_wr = user_data;

  for (;;)
    {
      g_autoptr(GBytes) bytes = NULL;

      bytes = dex_await_boxed (my_other_thing_bar (other, foo), NULL);

      {
        g_autoptr(MyThing) self = g_weak_ref_get (&self_wr);
        if (!self)
          return dex_future_new_true ();

        my_thing_write_bytes (self, bytes);
      }
    }
}
g_auto/g_steal helpers to mark ownership and ownership transfers (exceptions do apply)Still digging myself out of a backlog (and remembering how to computer), so probably no real post this week. I do have some exciting news for the blog though.
Now that various public announcements have been made, I can finally reveal the reason why I’ve been less active in Mesa of late is because I’ve been hard at work on Steam Frame. There’s a lot of very cool tech involved, and I’m planning to do some rundowns on the software-related projects I’ve been tackling.
Temper your expectations: I won’t be discussing anything hardware-related, and there will likely be no mentions of any specific game performance/issues.
Graphics drivers in Flatpak have been a bit of a pain point. The drivers have to be built against the runtime to work in the runtime. This usually isn’t much of an issue but it breaks down in two cases:
The first issue is what the proprietary Nvidia drivers exhibit. A specific user space driver requires a specific kernel driver. For drivers in Mesa, this isn’t an issue. In the medium term, we might get lucky here and the Mesa-provided Nova driver might become competitive with the proprietary driver. Not all hardware will be supported though, and some people might need CUDA or other proprietary features, so this problem likely won’t go away completely.
Currently we have runtime extensions for every Nvidia driver version which gets matched up with the kernel version, but this isn’t great.
The second issue is even worse, because we don’t even have a somewhat working solution to it. A runtime which is EOL doesn’t receive updates, and neither does the runtime extension providing GL and Vulkan drivers. New GPU hardware just won’t be supported and the software rendering fallback will kick in.
How we deal with this is rather primitive: keep updating apps, don’t depend on EOL runtimes. This is in general a good strategy. A EOL runtime also doesn’t receive security updates, so users should not use them. Users will be users though and if they have a goal which involves running an app which uses an EOL runtime, that’s what they will do. From a software archival perspective, it is also desirable to keep things working, even if they should be strongly discouraged.
In all those cases, the user most likely still has a working graphics driver, just not in the flatpak runtime, but on the host system. So one naturally asks oneself: why not just use that driver?
That’s a load-bearing “just”. Let’s explore our options.
Attempt #1: Bind mount the drivers into the runtime.
Cool, we got the driver’s shared libraries and ICDs from the host in the runtime. If we run a program, it might work. It might also not work. The shared libraries have dependencies and because we are in a completely different runtime than the host, they most likely will be mismatched. Yikes.
Attempt #2: Bind mount the dependencies.
We got all the dependencies of the driver in the runtime. They are satisfied and the driver will work. But your app most likely won’t. It has dependencies that we just changed under its nose. Yikes.
Attempt #3: Linker magic.
Until here everything is pretty obvious, but it turns out that linkers are actually quite capable and support what’s called linker namespaces. In a single process one can load two completely different sets of shared libraries which will not interfere with each other. We can bind mount the host shared libraries into the runtime, and dlmopen the driver into its own namespace. This is exactly what libcapsule does. It does have some issues though, one being that the libc can’t be loaded into multiple linker namespaces because it manages global resources. We can use the runtime’s libc, but the host driver might require a newer libc. We can use the host libc, but now we contaminate the apps linker namespace with a dependency from the host.
Attempt #4: Virtualization.
All of the previous attempts try to load the host shared objects into the app. Besides the issues mentioned above, this has a few more fundamental issues:
If we avoid getting code from the host into the runtime, all of those issues just go away, and GPU virtualization via Virtio-GPU with Venus allows us to do exactly that.
The VM uses the Venus driver to record and serialize the Vulkan commands, sends them to the hypervisor via the virtio-gpu kernel driver. The host uses virglrenderer to deserializes and executes the commands.
This makes sense for VMs, but we don’t have a VM, and we might not have the virtio-gpu kernel module, and we might not be able to load it without privileges. Not great.
It turns out however that the developers of virglrenderer also don’t want to have to run a VM to run and test their project and thus added vtest, which uses a unix socket to transport the commands from the mesa Venus driver to virglrenderer.
It also turns out that I’m not the first one who noticed this, and there is some glue code which allows Podman to make use of virgl.
You can most likely test this approach right now on your system by running two commands:
rendernodes=(/dev/dri/render*)
virgl_test_server --venus --use-gles --socket-path /tmp/flatpak-virgl.sock --rendernode "${rendernodes[0]}" &
flatpak run --nodevice=dri --filesystem=/tmp/flatpak-virgl.sock --env=VN_DEBUG=vtest --env=VTEST_SOCKET_NAME=/tmp/flatpak-virgl.sock org.gnome.clocks
If we integrate this well, the existing driver selection will ensure that this virtualization path is only used if there isn’t a suitable driver in the runtime.
Obviously the commands above are a hack. Flatpak should automatically do all of this, based on the availability of the dri permission.
We actually already start a host program and stop it when the app exits: xdg-dbus-proxy. It’s a bit involved because we have to wait for the program (in our case virgl_test_server) to provide the service before starting the app. We also have to shut it down when the app exits, but flatpak is not a supervisor. You won’t see it in the output of ps because it just execs bubblewrap (bwrap) and ceases to exist before the app even started. So instead we have to use the kernel’s automatic cleanup of kernel resources to signal to virgl_test_server that it is time to shut down.
The way this is usually done is via a so called sync fd. If you have a pipe and poll the file descriptor of one end, it becomes readable as soon as the other end writes to it, or the file description is closed. Bubblewrap supports this kind of sync fd: you can hand in a one end of a pipe and it ensures the kernel will close the fd once the app exits.
One small problem: only one of those sync fds is supported in bwrap at the moment, but we can add support for multiple in Bubblewrap and Flatpak.
For waiting for the service to start, we can reuse the same pipe, but write to the other end in the service, and wait for the fd to become readable in Flatpak, before exec’ing bwrap with the same fd. Also not too much code.
Finally, virglrenderer needs to learn how to use a sync fd. Also pretty trivial. There is an older MR which adds something similar for the Podman hook, but it misses the code which allows Flatpak to wait for the service to come up, and it never got merged.
Overall, this is pretty straight forward.
The virtualization approach should be a robust fallback for all the cases where we don’t get a working GPU driver in the Flatpak runtime, but there are a bunch of issues and unknowns as well.
It is not entirely clear how forwards and backwards compatible vtest is, if it even is supposed to be used in production, and if it provides a strong security boundary.
None of that is a fundamental issue though and we could work out those issues.
It’s also not optimal to start virgl_test_server for every Flatpak app instance.
Given that we’re trying to move away from blanket dri access to a more granular and dynamic access to GPU hardware via a new daemon, it might make sense to use this new daemon to start the virgl_test_server on demand and only for allowed devices.
AMD GPUs are famous for working very well on Linux. However, what about the very first GCN GPUs? Are they working as well as the new ones? In this post, I’m going to summarize how well these old GPUs are supported and what I’ve been doing to improve them.
This story is about the first two generations of GCN: Southern Islands (aka. SI, GCN1, GFX6) and Sea Islands (aka. CIK, GCN2, GFX7).
While AMD GPUs generally have a good reputation on Linux, these old GCN graphics cards have been a sore spot for as long as I’ve been working on the driver stack.
It occurred to me that resolving some of the long-standing issues on these old GPUs might be a great way to get me started on working on the amdgpu kernel driver and would help improve the default user experience of Linux users on these GPUs. I figured that it would give me a good base understanding, and later I could also start contributing code and bug fixes to newer GPUs.
The RADV team has supported RADV on SI and CIK GPUs for a long time. RADV support was already there even before I joined the team in mid-2019. Daniel added ACO support for GFX7 in November 2019, and Samuel added ACO support for GFX6 in January 2020. More recently, Martin added a Tahiti (GFX6) and Hawaii (GFX7) GPU to the Mesa CI which are running post-merge “nightly” jobs. So we can catch regressions and test our work on these GPUs quite quickly.
The kernel driver situation was less fortunate.
On the kernel side, amdgpu (the newer kernel driver) has supported CIK since June 2015 and SI since August 2016. DC (the new display driver) has supported CIK since September 2017 (the beginning), and SI support was added in July 2020 by Mauro. However, the old radeon driver was the default driver. Unfortunately, radeon doesn’t support Vulkan, so in the default user experience, users couldn’t play most games or benefit from any of the Linux gaming related work we’ve been doing for the last 10 years.
In order to get working Vulkan support on SI and CIK, we needed to use the following kernel params:
radeon.si_support=0 radeon.cik_support=0 amdgpu.si_support=1 amdgpu.cik_support=1
Then, you could boot with amdgpu and enjoy a semblance of a good user experience until the GPU crashed / hung, or until you tried to use some functionality which was missing from amdgpu, or until you plugged in a display which the display driver couldn’t handle.
It was… not the best user experience.
The first question that came to mind is, why wasn’t amdgpu the default kernel driver for these GPUs? Since the “experimental” support had been there for 10 years, we had thought the kernel devs would eventually just enable amdgpu by default, but that never happened. At XDC 2024 I met Alex Deucher, the lead developer of amdgpu and asked him what was missing. Alex explained to me that the main reason the default wasn’t switched is to avoid regressions for users who rely on some functionality not supported by amdgpu:
It doesn’t seem like much, does it? How hard can it be?
I messaged Alex Deucher to get some advice on where to start. Alex was very considerate and helped me to get a good understanding of how the code is organized, how the parts fit together and where I should start reading. Harry Wentland also helped a lot with making a plan how to fit analog connectors in DC. Then, I plugged my monitors into my Raphael iGPU to be used as a primary GPU, then plugged in an old Oland card as a secondary GPU, and started hacking.
For the display, I decided that the best way forward is to add what is missing from DC for these GPUs and use DC by default. That way, we can eventually get rid of the legacy display code (which was always meant as a temporary solution until DC landed).
Additionally, I decided to focus on dedicated GPUs because these are the most useful for gaming and are easy to test using a desktop computer. There is still work left to do for CIK APUs.
Analog connectors have been actually quite easy to deal with, once I understood the structure of the DC (display core) codebase. I could use the legacy display code as a reference. The DAC (digital to analog converter) is actually programmed by the VBIOS, and the driver just needs to call the VBIOS to tell it what to do. Easier said than done, but not too hard.
It also turned out that some chips that already defaulted to DC (eg. Tonga, Hawaii) also have analog connectors, which apparently just didn’t work on Linux by default. I managed to submit the first version of this in July. Then I was sidetracked with a lot of other issues, so I submitted the second version of the series in September, which then got merged.
It is incredibly difficult to debug issues when you don’t have the hardware to reproduce them yourself. Some developers have a good talent for writing patches to fix issues without actually seeing the issue, but I feel I still have a long way to go to be that good. It was pretty clear from the beginning that the only way to make sure my work actually works on all SI/CIK GPUs is to test all of them myself.
So, I went ahead an acquired at least one of each SI and CIK chip. I got most of them from used hardware ad sites, and Leonardo Frassetto sent me a few as well.
After I got the analog connector working using the old GPUs as a
secondary GPU, I thought it’s time to test how well it works
as a primary GPU. You know, the way most actual users would use them.
So I disabled the iGPU and booted my computer with each dGPU with amdgpu.dc=1 to see what happens.
This is where things started going crazy…
The way to debug these problems is the following:
amdgpu.dc=0, dump all DCE registers using umr:
umr -r oland.dce600..* > oland_nodc_good.txtamdgpu.dc=1, dump all DCE registers using umr:
umr -r oland.dce600..* > oland_dc_bad.txtI decided to fix the bugs before adding new features. I sent a few patch series to address a bunch of display issues mainly with SI (DCE6):
I noticed that HDMI audio worked alright on all GPUs with DC (as expected), however DP audio didn’t (which was unexpected). However it worked when both DP and HDMI were plugged in… After consulting with Alex and doing some trial and error, it turned out that this was just due to setting some clock frequency in the wrong way: Fix DP audio DTO1 clock source on DCE6.
In order to figure out the correct frequencies, I wrote a script that set the frequency using umr then played a sound. I just laid back and let the script run until I heard the sound. Then it was just a matter of figuring out why that frequency was correct.
A small fun fact: it turns out that DP audio on Tahiti didn’t work on any Linux driver before. Now it works with DC.
The DCE (Display Controller Engine), just like other parts of the GPU, has its own power requirements and needs certain clocks, voltages, etc. It is the responsibility of the power management code to make sure DCE gets the power it needs. Unfortunately, DC didn’t talk to the legacy power management code. Even more unfortunately, the power management code was buggy so that’s what I started with.
After I was mostly done with SI, I also fixed an issue with CIK, where the shutdown temperature was incorrectly reported.
Video encoding is usually an afterthought, not something that most users think about unless they are interested in streaming or video transcoding. It was definitely an afterthought for the hardware designers of SI, which has the first generation VCE (video coding engine) that only supports H264 and only up to 2048 x 1152. However, the old radeon kernel driver supports this engine and for anyone relying on this functionality, it would be a regression when switching to amdgpu. So we need to support it. There was already some work by Alexandre Demers to support VCE1, but that work was stalled due to issues caused by the firmware validation mechanism.
In order to switch SI to amdgpu by default, I needed to deal with VCE1. So I started a conversation with Christian König (amdgpu expert) to identify what the problem actually was, and with Alexandre to see how far along his work was.
Christian helped me a lot with understanding how the memory controller and the page table work.
After I got over the headache, I came up with this idea:
With that out of the way, the rest of the work on VCE1 was pretty straightforward. I could use Alexandre’s research, as well as the VCE2 code from amdgpu and the VCE1 code from radeon as a reference. Finally, a few reviews and three revisions later, the VCE1 series was accepted.
In the current economic situation of our world, I expect that people are going to use GPUs for much longer, and replace them less often. And when an old GPU is replaced, it doesn’t die, it goes to somebody who upgrades an even older GPU. Eventually it will reach somebody that can’t afford a better one. There are some efforts to use Linux to keep old computers alive, for example this one. My goal with this work is to make Linux gaming a good experience also for those who use old GPUs.
Other than that, I also did it for myself. Not because I want to run old GPUs myself, but because it has been a great learning experience to get into the amdgpu kernel driver.
The open source community including AMD themselves as well as other entities like Valve, Igalia, Red Hat etc. have invested a lot of time and effort into amdgpu and DC, which now support many generations of AMD GPUs: GCN1-5, RDNA1-4, as well as CDNA. In fact amdgpu supports more generations of GPUs now than what came before, and it looks like it will support many generations of future GPUs.
By making amdgpu work well with SI and CIK, we ensure that these GPUs remain competently supported for the foreseeable future.
By switching SI and CIK to use DC by default, we enable display features like atomic modesetting, VRR, HDR, etc. and this also allows the amdgpu maintainers to eventually move on from the legacy display code without losing functionality.
Now that amdgpu is at feature parity with radeon on old GPUs, we switched the default to amdgpu on SI and CIK dedicated GPUs. It’s time to start thinking about what else is left to do.
dmesg log will mention if the APU uses TRAVIS or NUTMEG.Kernel development is not as scary as it looks. It is a different technical challenge than what I was used to, but not in a bad way. Just needed to figure out a good workflow for how to configure a code editor, as well as what is a good way to test my work without rebuilding everything all the time.
AMD engineers have been very friendly and helpful to me all the way. Although there are a lot of memes and articles on the internet about attitude and rude/toxic messages by some kernel developers, I didn’t see that in amdgpu at least.
My approach was that even before I wrote a single line of code, I started talking to the maintainers (who would eventually review my patches) to find out what would be the good solution to them and how to get my work accepted. Communicating with the maintainers saved a lot of time and made the work faster, more pleasant and more collaborative.
Sadly, there is a huge latency between a Linux kernel developer working on something and the work reaching end users. Even if the patches are accepted quickly, it can take 3~6 months until users can actually use it.
In hindsight, if I had focused on finishing the analog support and VCE1 first (instead of fixing all the bugs I found), my work would have ended up in Linux 6.18 (including the bug fixes, as there is no deadline for those). Due to how I prioritized bug fixing, the features I’ve developed are only included in Linux 6.19, so this will be the version where SI and CIK will default to amdgpu by default.
I presented a lightning talk on this topic at XDC 2025, where I talked about the state of SI and CIK support as of September 2025. You can find the slide deck here and the video here.
I’d like to say a big thank you to all of these people. All of the work I mentioned in this post would not have been possible without them.
When in doubt, consult Wikipedia.
GFX6 aka. GCN1 - Southern Islands (SI) dedicated GPUs: amdgpu is now the default kernel driver as of Linux 6.19. The DC display driver is now the default and is now usable for these GPUs. DC now supports analog connectors, power management is less buggy, and video encoding is now supported by amdgpu.
GFX7 aka. GCN2 - Sea Islands (CIK) dedicated GPUs: amdgpu is now the default kernel driver as of Linux 6.19. The DC display driver is now the default for Bonaire (was already the case for Hawaii). DC now supports analog connectors. Minor bug fixes.
GFX8 aka. GCN3 - Volcanic Islands (VI) dedicated GPUs:
DC now supports analog connectors.
(Note that amdgpu and DC were already supported on these GPUs since release.)
On Dec 17 we released systemd v259 into the wild.
In the weeks leading up to that release (and since then) I have posted a series of serieses of posts to Mastodon about key new features in this release, under the #systemd259 hash tag. In case you aren't using Mastodon, but would like to read up, here's a list of all 25 posts:
I intend to do a similar series of serieses of posts for the next systemd release (v260), hence if you haven't left tech Twitter for Mastodon yet, now is the opportunity.
My series for v260 will begin in a few weeks most likely, under the #systemd260 hash tag.
In case you are interested, here is the corresponding blog story for systemd v258, here for v257, and here for v256.
After introducing how graphics drivers work in general, I’d like to give a brief overview about what is what in the Linux graphics stack, what are the important parts and what the key projects are where the development happens, as well as what you need to do to get the best user experience out of it.
Please refer to my previous post for a more detailed general explanation on graphics drivers in general. This post focuses on how things work in the open source graphics stack on Linux.
We have open source drivers for the GPUs from all major manufacturers with varying degrees of success.
The components you need in order to get your GPU working on open source drivers on a Linux distro are the following:
To make your GPU work, you need new enough versions of the Linux kernel, linux-firmware and Mesa (and LLVM) that include support for your GPU.
To make your GPU work well, I highly recommend to use the latest stable versions of all of the above. If you use old versions, you are missing out. By using old versions you are choosing not to benefit from the latest developments (features and bug fixes) that open source developers have worked on, and you will have a sub-par experience (especially on relatively new hardware).
If you read Reddit posts, you will stumble upon some people who believe that “the drivers are in the kernel” on Linux. This is a half-truth. Only the KMDs are part of the kernel, everything else (linux-firmware, Mesa, LLVM) is distributed in separate packges. How exactly those packages are organized, depends on your distribution.
Mesa is a collection of userspace drivers which implement various different APIs. It is the cornerstone of the open source graphics stack. I’m going to attempt to give a brief overview of what are the most relevant parts of Mesa.
An important part of Mesa is the Gallium driver infrastructure, which contains a lot of common code for implementing different APIs, such as:
Mesa also contains a collection of Vulkan drivers. Originally, Vulkan was deemed “lower level than Gallium”, so Vulkan drivers are not part of the Gallium driver infrastructure. However, Vulkan has a lot of overlapping functionality with the aforementioned APIs, so Vulkan drivers still share a lot of code with their Gallium counterparts when appropriate.
Another important part of Mesa is the NIR shader compiler stack, which is at the heart of every Mesa driver that is still being maintained. This enables sharing a lot of compiler code across different drivers. I highly recommend Faith Ekstrand’s post In defense of NIR to learn more about it.
Technically they are not drivers, but in practice, if you want to run Windows games, you will need a compatibility layer like Wine or Proton, including graphics translation layers. The recommended ones are:
Those are default in Proton and offer the best performance. However, for “political” reasons, these are sadly not the defaults in Wine, so either you’ll have to use Proton or make sure to install the above in Wine manually.
Just for the sake of completeness, I’ll also mention the Wine defaults:
Despite the X server being abandoned for a long time, there is still a debate between Linux users whether to use a Wayland compositor or the X server. I’m not going to discuss the advantages and disadvantages of these, because I don’t participate in their development and I feel it has already been well-explained by the community.
I’m just going to say that it helps to choose a competent compositor that implements direct scanout. This means that the frames as rendered by your game can be sent directly to the display without the need for the compositor to do any additional processing on it.
In this blog post I focus on just the driver stack, because that is largely shared between both solutions.
Sadly, many Linux distributions choose to ship old versions of the kernel and/or other parts of the driver stack, giving their users a sub-par experience. Debian, Ubuntu LTS and their derivatives like Mint, Pop OS, etc. are all guilty of this. They justify this by claiming that older versions are more reliable, but this is actually not true.
In reality, us driver developers as well as the developers of the API translation layers work hard to implement new features that are needed to get new games working, as well as fixing bugs that are exposed by new games (or updates of old games).
Regressions are real, but they are usually quickly fixed thanks to the extensive testing that we do: every time we merge new code, our automated testing system runs the full Vulkan conformance test suite to make sure that all functionality is still intact, thanks to Martin’s genious.
Hi all!
This month the new KMS plane color pipeline API has finally been merged! It took multiple years and continued work and review by engineers from multiple organizations, but at last we managed to push it over the finish line. This new API exposes to user-space new hardware blocks: these applying color transformations before blending multiple KMS planes as a final composited image to be sent on the wire. This API unlocks power-efficient and low-latency color management features such as HDR.
Still, much remains to be done. Color pipelines are now exposed on AMD and
VKMS, Intel and other vendors are still working on their driver implementation.
Melissa Wen has written a drm_info patch to show pipeline
information, some more work is needed to plumb it through drmdb. Some patches
have been floated to leverage color pipelines for post-blending transforms too
(currently KMS only supports a fixed rudimentary post-blending pipeline with
two LUTs and one 3×3 matrix).
On the wlroots side, Félix Poisot has redesigned the way post-blending color transforms are applied by the renderer. The API used to be a mix of descriptive (describing which primaries and transfer functions the output buffer uses) and prescriptive (passing a list of operations to apply). Now it’s fully prescriptive, which will help for offloading these transformations to the DRM backend.
GnSight has contributed support for the
wlr-foreign-toplevel-management-v1 protocol to the Cage kiosk compositor.
This enables better control over windows running inside the compositor:
external tools can close or bring windows to the front.
mhorky has added client support for one-way method calls to go-varlink, as
well as a nice Registry enhancement to add support for the
org.varlink.service interface for free, for discovery and introspection of
Varlink services. Now that the module is feature-complete I’ve released version
0.1.0.
delthas has introduced support for authenticating with the soju IRC bouncer via TLS client certificates. He has contributed a simple audio recorder to the Goguma mobile IRC client, plus new buttons above the reaction list to be able to easily +1 another user’s reaction. Hubert Hirtz has sent a collection of bug fixes and has added a button to reveal the password field contents on the connection screen.
I’ve resurrected work on some old projects I’d almost forgotten about. I’ve pushed a few patches for libicc, adding support for encoding multi-process transforms, luminance and metadata. I’ve added a basic test suite to libjsonschema, and improved handling of objects and arrays without enough information to automatically generate types from.
But the old project I’ve spent most of my time on is go-mls, a Go implementation of the Messaging Layer Security (MLS) protocol. MLS is an end-to-end encryption protocol for chat messages. My goal is twofold: learn how MLS works under the hood (implementing something is one of the best ways for me to understand that something), and lay the groundwork for a future end-to-end encryption IRC extension. This month I’ve fixed up the remaining failures in the test suite and I’ve implemented just enough to be able to create a group, add members to it, and exchange an encrypted message. I’ll work on remaining group operations (e.g. removing a member) next.
Last, I’ve migrated FreeDesktop’s Mailman 3 installation to PostgreSQL from SQLite. Mailman 3’s SQLite integration had pretty severe performance issues, these are gone with PostgreSQL. The migration wasn’t straightforward: there is no tooling to migrate Mailman 3 core’s data between database engines, so I had to manually fill the new database with the old data. I’ve migrated two more mailing lists to Mailman 3: fhs and nouveau. I plan to continue the migration in the coming months, and hopefully we’ll be able to decommission Mailman 2 in a not-so-distant future.
See you next year!
I’d like to give an overview on how graphics drivers work in general, and then write a little bit about the Linux graphics stack for AMD GPUs. The intention of this post is to clear up a bunch of misunderstandings that people have on the internet about open source graphics drivers.
A graphics driver is a piece of software code that is written for the purpose of allowing programs on your computer to access the features of your GPU. Every GPU is different and may have different capabilities or different ways of achieving things, so they need different drivers, or at least different code paths in a driver that may handle multiple GPUs from the same vendor and/or the same hardware generation.
The main motivation for graphics drivers is to allow applications to utilize your hardware efficiently. This enables games to render pretty pixels, scientific apps to calculate stuff, as well as video apps to encode / decode efficiently.
Compared to drivers for other hardware, graphics is very complicated because the functionality is very broad and the differences between each piece of hardware can be also vast.
Here is a simplified explanation on how a graphics driver stack usually works. Note that most of the time, these components (or some variation) are bundled together to make them easier to use.
I’ll give a brief overview of each component below.
Most GPUs have additional processors (other than the shader cores) which run a firmware that is responsible for operating the low-level details of the hardware, usually stuff that is too low-level even for the kernel.
The firmware on those processors are responsible for: power management, context switching, command processing, display, video encoding/decoding etc. Among other things it parses the commands we submitted to it, launches shaders, distributes work between the shader cores etc.
Some GPU manufacturers are moving more and more functionality to firmware, which means that the GPU can operate more autonomously and less intervention is needed by the CPU. This tendency is generally positive for reducing CPU time spent on programming the GPU (as well as “CPU bubbles”), but at the same time it also means that the way the GPU actually works becomes less transparent.
You might ask, why not implement all driver functionality in the kernel? Wouldn’t it be simpler to “just” have everything in the kernel? The answer is no, mainly because there is a LOT going on which nobody wants in the kernel.
So, usually, the KMD is only left with some low-level tasks that every user needs:
Applications interact with userspace drivers instead of the kernel (or the hardware directly). Userspace drivers are compiled as shared libraries and are responsible for implementing one or more specific APIs for graphics, compute or video for a specific family of GPUs. (For example, Vulkan, OpenGL or OpenCL, etc.) Each graphics API has entry points which load the available driver(s) for the GPU(s) in the user’s system. The Vulkan loader is an example of this; other APIs have similar components for this purpose.
The main functionality of a userspace driver is to take the commands from the API (for example, draw calls or compute dispatches) and turn them into low level commands in a binary format that the GPU can understand. In Vulkan, this is analogous to recording a command buffer. Additionally, they utilize a shader compiler to turn a higher level shader language (eg. GLSL) or bytecode (eg. SPIR-V) into hardware instructions which the GPU’s shader cores can execute.
Furthermore, userspace drivers also take part in memory management, they basically act as an interface between the memory model of the graphics API and kernel’s memory manager.
The userspace driver calls the aforementioned kernel uAPI to submit the recorded commands to the kernel which then schedules it and hands it to the firmware to be executed.
If you’ve seen a loading screen in your favourite game which told you it was “compiling shaders…” you probably wondered what that’s about and why it’s necessary.
Unlike CPUs which have converged to a few common instruction set architectures (ISA), GPUs are a mess and don’t share the same ISA, not even between different GPU models from the same manufacturer. Although most modern GPUs have converged to SIMD based architectures, the ISA is still very different between manufacturers and it still changes from generation to generation (sometimes different chips of the same generation have slightly different ISA). GPU makers keep adding new instructions when they identify new ways to implement some features more effectively.
To deal with all that mess, graphics drivers have to do online compilation of shaders (as opposed to offline compilation which usually happens for apps running on your CPU).
This means that shaders have to be recompiled when the userspace graphics driver is updated either because new functionality is available or because bug fixes were added to the driver and/or compiler.
On some systems (especially proprietary operating systems like Windows), GPU manufacturers intend to make users’ lives easier by offering all of the above in a single installer package, which is just called “the driver”.
Typically such a package includes:
On some systems (typically on open source systems like Linux distributions), usually you can already find a set of packages to handle most common hardware, so you can use most functionality out of the box without needing to install anything manually.
Neat, isn’t it?
However, on open source systems, the graphics stack is more transparent, which means that there are many parts that are scattered across different projects, and in some cases there is more than one driver available for the same HW. To end users, it can be very confusing.
However, this doesn’t mean that open source drivers are designed worse. It is just that due to their community oriented nature, they are organized differently.
One of the main sources of confusion is that various Linux distributions mix and match different versions of the kernel with different versions of different UMDs which means that users of different distros can get a wildly different user experience based on the choices made for them by the developers of the distro.
Another source of confusion is that we driver developers are really, really bad at naming things, so sometimes different projects end up having the same name, or some projects have nonsensical or outdated names.
In the next post, I’ll continue this story and discuss how the above applies to the open source Linux graphics stack.
Hey, I have been under distress lately due to personal circumstances that are outside my control. I cannot find a permanent job that allows me to function, I am not eligible for government benefits, my grant proposals to work on free and open-source projects got rejected, paid internships are quite difficult to find, especially when many of them prioritize new contributors. Essentially, I have no stable, monthly income that allows me to sustain myself.
Nowadays, I mostly volunteer to improve accessibility throughout GNOME apps, either by enhancing the user experience for people with disabilities, or enabling them to use them. I helped make most of GNOME Calendar accessible with a keyboard and screen reader, with additional ongoing effort involving merge requests !564 and !598 to make the month view accessible, all of which is an effort no company has ever contributed to, or would ever contribute to financially. These merge requests require literal thousands of hours for research, development, and testing, enough to sustain me for several years if I were employed.
I would really appreciate any kinds of donations, especially ones that happen periodically to increase my monthly income. These donations will allow me to sustain myself while allowing me to work on accessibility throughout GNOME, essentially ‘crowdfunding’ development without doing it on the behalf of the GNOME Foundation or another organization.
Together with my then-colleague Kalev Lember, I recently added support for pre-installing Flatpak applications. It sounds fancy, but it is conceptually very simple: Flatpak reads configuration files from several directories to determine which applications should be pre-installed. It then installs any missing applications and removes any that are no longer supposed to be pre-installed (with some small caveats).
For example, the following configuration tells Flatpak that the devel branch of the app org.test.Foo from remotes which serve the collection org.test.Collection, and the app org.test.Bar from any remote should be installed:
[Flatpak Preinstall org.test.Foo]
CollectionID=org.test.Collection
Branch=devel

[Flatpak Preinstall org.test.Bar]
By dropping in another confiuration file with a higher priority, pre-installation of the app org.test.Foo can be disabled:
[Flatpak Preinstall org.test.Foo]
Install=false
The installation procedure is the same as it is for the flatpak-install command. It supports installing from remotes and from side-load repositories, which is to say from a repository on a filesystem.
This simplicity also means that system integrators are responsible for assembling all the parts into a functioning system, and that there are a number of choices that need to be made for installation and upgrades.
The simplest way to approach this is to just ship a bunch of config files in /usr/share/flatpak/preinstall.d and config files for the remotes from which the apps are available. In the installation procedure, flatpak-preinstall is called and it will download the Flatpaks from the remotes over the network into /var/lib/flatpak. This works just fine, until someone needs one of those apps but doesn’t have a suitable network connection.
The next way one could approach this is exactly the same way, but with a sideload repository on the installation medium which contains the apps that will get pre-installed. The flatpak-preinstall command needs to be pointed at this repository at install time, and the process which creates the installation medium needs to be adjusted to create this repository. The installation process now works without a network connection. System updates are usually downloaded over the network, just as new pre-installed applications will be.
It is also possible to simply skip flatpak-preinstall, and use flatpak-install to create a Flatpak installation containing the pre-installed apps which get shipped on the installation medium. This installation can then be copied over from the installation medium to /var/lib/flatpak in the installation process. It unfortunately also makes the installation process less flexible because it becomes impossible to dynamically build the configuration.
On modern, image-based operating systems, it might be tempting to just ship this Flatpak installation on the image because the flexibility is usually neither required nor wanted. This currently does not work for the simple reason that the default system installation is in /var/lib/flatpak, which is not in /usr which is the mount point of the image. If the default system installation was in the image, then it would be read-only because the image is read-only. This means we could not update or install anything new to the system installation. If we make it possible to have two different system installations — one in the image, and one in /var — then we could update and install new things, but the installation on the image would become useless over time because all the runtimes and apps will be in /var anyway as they get updated.
All of those issues mean that even for image-based operating systems, pre-installation via a sideload repository is not a bad idea for now. It is however also not perfect. The kind of “pure” installation medium which is simply an image now contains a sideload repository. It also means that a factory reset functionality is not possible because the image does not contain the pre-installed apps.
In the future, we will need to revisit these approaches to find a solution that works seamlessly with image-based operating systems and supports factory reset functionality. Until then, we can use the systems mentioned above to start rolling out pre-installed Flatpaks.
F43 picked up the two patches I created to fix a bunch of deadlocks on laptops reported in my previous blog posting. Turns out Vulkan layers have a subtle thing I missed, and I removed a line from the device select layer that would only matter if you have another layer, which happens under steam.
The fedora update process caught this, but it still got published which was a mistake, need to probably give changes like this more karma thresholds.
I've released a new update https://bodhi.fedoraproject.org/updates/FEDORA-2025-2f4ba7cd17 that hopefully fixes this. I'll keep an eye on the karma.
XDC 2025 happened at the end of September, beginning of October this year, in Kuppelsaal, the historic TU Wien building in Vienna. XDC, The X.Org Developer’s Conference, is truly the premier gathering for open-source graphics development. The atmosphere was, as always, highly collaborative and packed with experts across the entire stack.
I was thrilled to present, together with my workmate Ella Stanforth, on the progress we have made in enhancing the Raspberry Pi GPU driver stack. Representing the broader Igalia Graphics Team that work on this GPU, Ella and I detailed the strides we have made in the OpenGL driver, though part of the improvements affect also the Vulkan driver.
The presentation was divided in two parts. In the first one, we talked about the new features that we were implementing, or are under implementation, mainly to make the driver more closely aligned with OpenGL 3.2. Key features explained were 16-bit Normalized Format support, Robust Context support, and Seamless cubemap implementation.
Beyond these core OpenGL updates, we also highlighted other features, such as NIR printf support, framebuffer fetch or dual source blend, which is important for some game emulators.
The second part was focused on specific work done to improve the performance. Here, we started with different traces from the popular GFXBench application, and explained the main improvements done throughout the year, with a look at how much each of these changes improved the performance for each of the benchmarks (or in average).
At the end, for some benchmarks we nearly doubled the performance compared to last year. I won’t explain here each of the changes done, But I encourage the reader to watch the talk, which is already available.
For those that prefer to check the slides instead of the full video, you can view them here:
Outside of the technical track, the venue’s location provided some excellent down time opportunities to have lunch at different nearby places. I need to highlight here one that I really enjoyed: An’s Kitchen Karlsplatz. This cozy Vietnamese street food spot quickly became one of my favourite places, and I went there a couple of times.
On the last day, I also had the opportunity to visit some of the most recomendable sightseeings spots in Vienna. Of course, one needs more than a half-day to do a proper visit, but at least it helps to spark an interest to write it down to pay a full visit to the city.
Meanwhile, I would like to thank all the conference organizers, as well as all the attendees, and I look forward to see them again.
Already on Sep 17 we released systemd v258 into the wild.
In the weeks leading up to that release I have posted a series of serieses of posts to Mastodon about key new features in this release, under the #systemd258 hash tag. It was my intention to post a link list here on this blog right after completing that series, but I simply forgot! Hence, in case you aren't using Mastodon, but would like to read up, here's a list of all 37 posts:
I intend to do a similar series of serieses of posts for the next systemd release (v259), hence if you haven't left tech Twitter for Mastodon yet, now is the opportunity.
We intend to shorten the release cycle a bit for the future, and in fact managed to tag v259-rc1 already yesterday, just 2 months after v258. Hence, my series for v259 will begin soon, under the #systemd259 hash tag.
In case you are interested, here is the corresponding blog story for systemd v257, and here for v256.
It has been a long time since I published any update in this space. Since this was a year of colossal changes for me, maybe it is also time for me to make something different with this blog and publish something just for a change — why not start talking about XDC 2025?
This year, I attended XDC 2025 in Vienna as an Igalia developer. I was thrilled to see some faces from people I worked with in the past and people I’m working with now. I had a chance to hang out with some folks I worked with at AMD (Harry, Alex, Leo, Christian, Shashank, and Pierre), many Igalians (Žan, Job, Ricardo, Paulo, Tvrtko, and many others), and finally some developers from Valve. In particular, I met Tímur in person for the first time, even though we have been talking for months about GPU recovery. Speaking of GPU recovery, we held a workshop on this topic together.
The workshop was packed with developers from different companies, which was nice because it added different angles on this topic. We began our discussion by focusing on the topic of job resubmission. Christian began sharing a brief history of how the AMDGPU driver started handling resubmission and the associated issues. After learning from erstwhile experience, amdgpu ended up adopting the following approach:
Below, you can see one crucial series associated with amdgpu recovery implementation:
The next topic was a discussion around the
replacement of drm_sched_resubmit_jobs() since this function became
deprecated. Just a few drivers still use this function, and they need a
replacement for that. Some ideas were floating around to extract part of the
specific implementation from some drivers into a generic function. The next
day, Philipp Stanner continued to discuss this topic in his workshop,
DRM GPU Scheduler.
Another crucial topic discussed was improving GPU reset debuggability to narrow down which operations cause the hang (keep in mind that GPU recovery is a medicine, not the cure to the problem). Intel developers shared their strategy for dealing with this by obtaining hints from userspace, which helped them provide a better set of information to append to the devcoredump. AMD could adopt this alongside dumping the IB data into the devcoredump (I am already investigating this).
Finally, we discussed strategies to avoid hang issues regressions. In summary, we have two lines of defense:
This year, as always, XDC was super cool, packed with many engaging presentations which I highly recommend everyone check out. If you are interested, check the schedule and the presentation recordings available on the X.Org Foundation Youtube page. Anyway, I hope this blog post marks the inauguration of a new era for this site, where I will start posting more content ranging from updates to tutorials. See you soon.
Hi!
This month a lot of new features have added to the Goguma mobile IRC client. Hubert Hirtz has implemented drafts so that unsent text gets saved and network disconnections don’t disrupt users typing a message. He also enabled replying to one’s own messages, changed the appearance of short messages containing only emoji, upgraded our emoji library to Unicode version 16, fixed some linkifier bugs and added unit tests.

Markus Cisler has added a new option in the message menu to show a user’s
profile. I’ve added an on-disk cache for images (with our own implementation,
because the widely used cached_network_image package is heavyweight). I’ve
been working on displaying network icons and blocking users, but that work is
not finished yet. I’ve also contributed some maintenance fixes for our
webcrypto.dart dependency (toolkit upgrades and CI fixes).
The soju IRC bouncer has also got some love this month. delthas has
contributed support for labeled-response for soju clients,
allowing more reliable matching of server replies with client commands. I’ve
introduced a new icon directive to configure an image representing the
bouncer. soju v0.10.0 has been released, followed by soju v0.10.1 including
bug fixes from Karel Balej and Taavi Väänänen.
In Wayland news, wlroots v0.19.2 and v0.18.3 have been released thanks to Simon Zeni. I’ve added support for the color-representation protocol for the Vulkan renderer, allowing clients to configure the color encoding and range for YCbCr content. Félix Poisot has been hard at work with more color management patches: screen default color primaries are now extracted from the EDID and exposed to compositors, the cursor is now correctly converted to the output’s primaries and transfer function, and some work-in-progress patches switch the renderer API from a descriptive model to a prescriptive model.
go-webdav v0.7.0 has been released with a patch from prasad83 to play well with Thunderbird. I’ve updated clients to make multi-status errors non-fatal, returning partial data alongside the error.
I’ve released drm_info v2.9.0 with improvements mentioned in the previous
status update plus support for the TILE connector property.
See you next month!
I had a bug appear in my email recently which led me down a rabbit hole, and I'm going to share it for future people wondering why we can't have nice things.
1. Get an intel/nvidia (newer than Turing) laptop.
2. Log in to GNOME on Fedora 42/43
3. Hotplug a HDMI port that is connected to the NVIDIA GPU.
4. Desktop stops working.
My initial reproduction got me a hung mutter process with a nice backtrace which pointed at the Vulkan Mesa device selection layer, trying to talk to the wayland compositor to ask it what the default device is. The problem was the process was the wayland compositor, and how was this ever supposed to work. The Vulkan device selection was called because zink called EnumeratePhysicalDevices, and zink was being loaded because we recently switched to it as the OpenGL driver for newer NVIDIA GPUs.
I looked into zink and the device select layer code, and low and behold someone has hacked around this badly already, and probably wrongly and I've no idea what the code does, because I think there is at least one logic bug in it. Nice things can't be had because hacks were done instead of just solving the problem.
The hacks in place ensured under certain circumstances involving zink/xwayland that the device select code to probe the window system was disabled, due to deadlocks seen. I'd no idea if more hacks were going to help, so I decided to step back and try and work out better.
The first question I had is why WAYLAND_DISPLAY is set inside the compositor process, it is, and if it wasn't I would never hit this. It's pretty likely on the initial compositor start this env var isn't set, so the problem only becomes apparent when the compositor gets a hotplugged GPU output, and goes to load the OpenGL driver, zink, which enumerates and hits device select with env var set and deadlocks.
I wasn't going to figure out a way around WAYLAND_DISPLAY being set at this point, so I leave the above question as an exercise for mutter devs.
At the point where zink is loading in mesa for this case, we have the file descriptor of the GPU device that we want to load a driver for. We don't actually need to enumerate all the physical devices, we could just find the ones for that fd. There is no API for this in Vulkan. I wrote an initial proof of concept instance extensions call VK_MESA_enumerate_devices_fd. I wrote initial loader code to play with it, and wrote zink code to use it. Because this is a new instance API, device-select will also ignore it. However this ran into a big problem in the Vulkan loader. The loader is designed around some internals that PhysicalDevices will enumerate in similiar ways, and it has to trampoline PhysicalDevice handles to underlying driver pointers so that if an app enumerates once, and enumerates again later, the PhysicalDevice handles remain consistent for the first user. There is a lot of code, and I've no idea how hotplug GPUs might fail in such situations. I couldn't find a decent path forward without knowing a lot more about the Vulkan loader. I believe this is the proper solution, as we know the fd, we should be able to get things without doing a full enumeration then picking the answer using the fd info. I've asked Vulkan WG to take a look at this, but I still need to fix the bug.
Maybe I can just turn off device selection, like the current hacks do, but in a better manner. Enter VK_EXT_layer_settings. This extensions allows layers to expose a layer setting in the instance creation. I can have the device select layer expose a setting which says don't touch this instance. Then in the zink code where we have a file descriptor being passed in and create an instance, we set the layer setting to avoid device selection. This seems to work but it has some caveats, I need to consider, but I think should be fine.
zink uses a single VkInstance for it's device screen. This is shared between all pipe_screens. Now I think this is fine inside a compositor, since we shouldn't ever be loading zink via the non-fd path, and I hope for most use cases it will work fine, better than the current hacks and better than some other ideas we threw around. The code for this is in [1].
If you have a vulkan compositor, it might be worth setting the layer setting if the mesa device select layer is loaded, esp if you set the DISPLAY/WAYLAND_DISPLAY and do any sort of hotplug later. You might be safe if you EnumeratePhysicalDevices early enough, the reason it's a big problem in mutter is it doesn't use Vulkan, it uses OpenGL and we only enumerate Vulkan physical devices at runtime through zink, never at startup.
AMD and NVIDIA I think have proprietary device selection layers, these might also deadlock in similiar ways, I think we've seen some wierd deadlocks in NVIDIA driver enumerations as well that might be a similiar problem.
[1] https://gitlab.freedesktop.org/mesa/mesa/-/merge_requests/38252
Yesterday I released Flatpak 1.17.0. It is the first version of the unstable 1.17 series and the first release in 6 months. There are a few things which didn’t make it for this release, which is why I’m planning to do another unstable release rather soon, and then a stable release still this year.
Back at LAS this year I talked about the Future of Flatpak and I started with the grim situation the project found itself in: Flatpak was stagnant, the maintainers left the project and PRs didn’t get reviewed.
Some good news: things are a bit better now. I have taken over maintenance, Alex Larsson and Owen Taylor managed to set aside enough time to make this happen and Boudhayan Bhattcharya (bbhtt) and Adrian Vovk also got more involved. The backlog has been reduced considerably and new PRs get reviewed in a reasonable time frame.
I also listed a number of improvements that we had planned, and we made progress on most of them:
Besides the changes directly in Flatpak, there are a lot of other things happening around the wider ecosystem:
What I have also talked about at my LAS talk is the idea of a Flatpak-Next project. People got excited about this, but I feel like I have to make something very clear:
If we redid Flatpak now, it would not be significantly better than the current Flatpak! You could still not do nested sandboxing, you would still need a D-Bus proxy, you would still have a complex permission system, and so on.
Those problems require work outside of Flatpak, but have to integrate with Flatpak and Flatpak-Next in the future. Some of the things we will be doing include:
So if you’re excited about Flatpak-Next, help us to improve the Flatpak ecosystem and make Flatpak-Next more feasible!

This was the first year I attended Kernel Recipes and I have nothing but say how much I enjoyed it and how grateful I’m for the opportunity to talk more about kworkflow to very experienced kernel developers. What I mostly like about Kernel Recipes is its intimate format, with only one track and many moments to get closer to experts and people that you commonly talk online during your whole year.
In the beginning of this year, I gave the talk Don’t let your motivation go, save time with kworkflow at FOSDEM, introducing kworkflow to a more diversified audience, with different levels of involvement in the Linux kernel development.
At this year’s Kernel Recipes I presented the second talk of the first day: Kworkflow - mix & match kernel recipes end-to-end.
The Kernel Recipes audience is a bit different from FOSDEM, with mostly long-term kernel developers, so I decided to just go directly to the point. I showed kworkflow being part of the daily life of a typical kernel developer from the local setup to install a custom kernel in different target machines to the point of sending and applying patches to/from the mailing list. In short, I showed how to mix and match kernel workflow recipes end-to-end.
As I was a bit fast when showing some features during my presentation, in this blog post I explain each slide from my speaker notes. You can see a summary of this presentation in the Kernel Recipe Live Blog Day 1: morning.
Hi, I’m Melissa Wen from Igalia. As we already started sharing kernel recipes and even more is coming in the next three days, in this presentation I’ll talk about kworkflow: a cookbook to mix & match kernel recipes end-to-end.
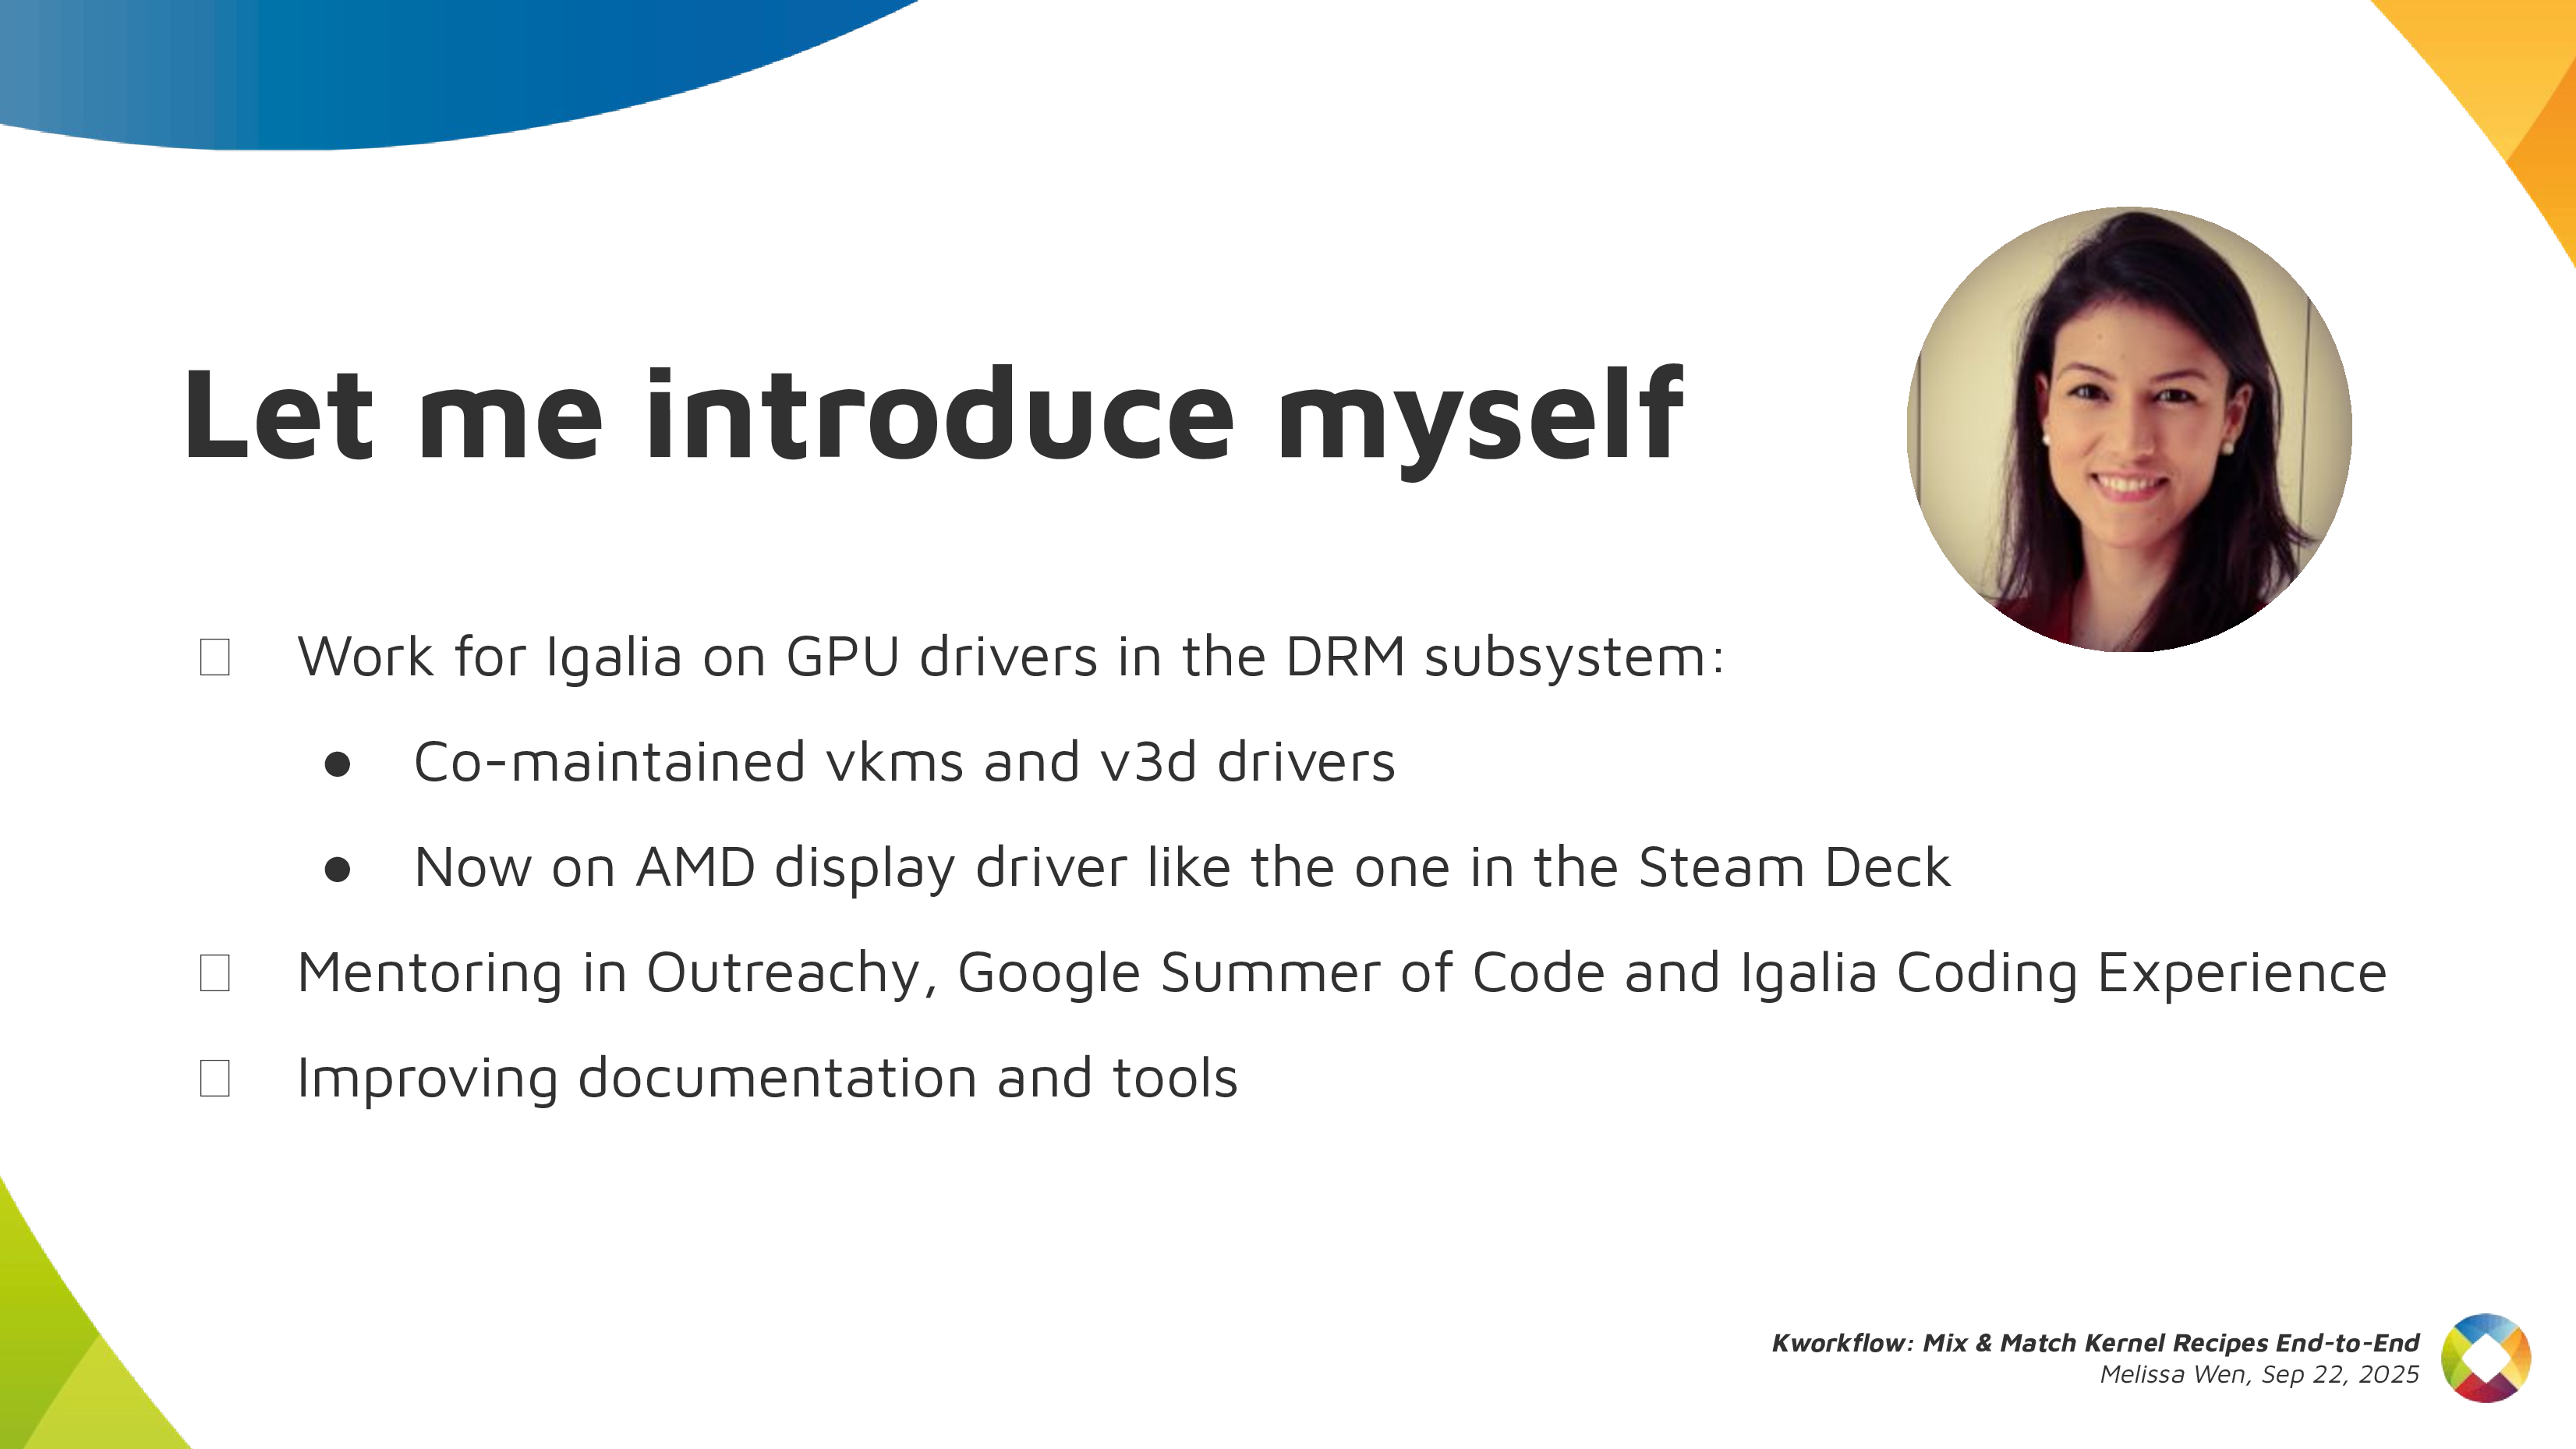
This is my first time attending Kernel Recipes, so lemme introduce myself briefly.

And what’s this cookbook called kworkflow?
Kworkflow is a tool created by Rodrigo Siqueira, my colleague at Igalia. It’s a single platform that combines software and tools to:
It’s mostly done by volunteers, kernel developers using their spare time. Its features cover real use cases according to kernel developer needs.
Basically it’s mixing and matching the daily life of a typical kernel developer with kernel workflow recipes with some secret sauces.

So, it’s time to start the first recipe: A good GPU driver for my AMD laptop.
Before starting any recipe we need to check the necessary ingredients and tools. So, let’s check what you have at home.
With kworkflow, you can use:
kw device: to get information about the target machine, such as: CPU model,
kernel version, distribution, GPU model,
kw remote: to set the address of this machine for remote access
kw config: you can configure kw with kw config. With this command you can
basically select the tools, flags and preferences that kw will use to build
and deploy a custom kernel in a target machine. You can also define recipients
of your patches when sending it using kw send-patch. I’ll explain more about
each feature later in this presentation.
kw kernel-config manager (or just kw k): to fetch the kernel .config file
from a given machine, store multiple .config files, list and retrieve them
according to your needs.
Now, with all ingredients and tools selected and well portioned, follow the right steps to prepare your custom kernel!
First step: Mix ingredients with kw build or just kw b
kw b and its options wrap many routines of compiling a custom kernel.
kw b -i to check the name and kernel version and the number
of modules that will be compiled and kw b --menu to change kernel
configurations.kw b to compile the custom kernel for a target
machine.Second step: Bake it with kw deploy or just kw d

After compiling the custom kernel, we want to install it in the target machine.
Check the name of the custom kernel built: 6.17.0-rc6 and with kw s SSH
access the target machine and see it’s running the kernel from the Debian
distribution 6.16.7+deb14-amd64.
As with building settings, you can also pre-configure some deployment settings, such as compression type, path to device tree binaries, target machine (remote, local, vm), if you want to reboot the target machine just after deploying your custom kernel, and if you want to boot in the custom kernel when restarting the system after deployment.
If you didn’t pre-configured some options, you can still customize as a command
option, for example: kw d --reboot will reboot the system after deployment,
even if I didn’t set this in my preference.
With just running kw d --reboot I have installed the kernel in a given target
machine and rebooted it. So when accessing the system again I can see it was
booted in my custom kernel.
Third step: Time to taste with kw debug
kw debug wraps many tools for validating a kernel in a target machine. We
can log basic dmesg info but also tracking events and ftrace.
kw debug --dmesg --history we can grab the full dmesg log from a
remote machine, if you use the --follow option, you will monitor dmesg
outputs. You can also run a command with kw debug --dmesg --cmd="<my
command>" and just collect the dmesg output related to this specific execution
period.kw drm
--gui-off to drop the graphical interface and release the amdgpu for
unloading it. So I run kw debug --dmesg --cmd="modprobe -r amdgpu" to unload
the amdgpu driver, but it fails and I couldn’t unload it.
Oh no! That custom kernel isn’t tasting good. Don’t worry, as in many recipes preparations, we can search on the internet to find suggestions on how to make it tasteful, alternative ingredients and other flavours according to your taste.
With kw patch-hub you can search on the lore kernel mailing list for possible
patches that can fix your kernel issue. You can navigate in the mailing lists,
check series, bookmark it if you find it relevant and apply it in your local
kernel tree, creating a different branch for tasting… oops, for testing. In
this example, I’m opening the amd-gfx mailing list where I can find
contributions related to the AMD GPU driver, bookmark and/or just apply the
series to my work tree and with kw bd I can compile & install the custom kernel
with this possible bug fix in one shot.
As I changed my kw config to reboot after deployment, I just need to wait for
the system to boot to try again unloading the amdgpu driver with kw debug
--dmesg --cm=modprobe -r amdgpu. From the dmesg output retrieved by kw for
this command, the driver was unloaded, the problem is fixed by this series and
the kernel tastes good now.
If I’m satisfied with the solution, I can even use kw patch-hub to access the
bookmarked series and marking the checkbox that will reply the patch thread
with a Reviewed-by tag for me.
As in all recipes, we need ingredients and tools, but with kworkflow you can get everything set as when changing scenarios in a TV show. We can use kw env to change to a different environment with all kw and kernel configuration set and also with the latest compiled kernel cached.
I was preparing the first recipe for a x86 AMD laptop and with kw env --use
RPI_64 I use the same worktree but moved to a different kernel workflow, now
for Raspberry Pi 4 64 bits. The previous compiled kernel 6.17.0-rc6-mainline+
is there with 1266 modules, not the 6.17.0-rc6 kernel with 285 modules that I
just built&deployed. kw build settings are also different, now I’m targeting
a arm64 architecture with a cross-compiled kernel using aarch64-linu-gnu-
cross-compilation tool and my kernel image calls kernel8 now.
If you didn’t plan for this recipe in advance, don’t worry. You can create a
new environment with kw env --create RPI_64_V2 and run kw init --template
to start preparing your kernel recipe with the mirepoix ready.
I mean, with the basic ingredients already cut…
I mean, with the kw configuration set from a template.
And you can use kw remote to set the IP address of your target machine and
kw kernel-config-manager to fetch/retrieve the .config file from your target
machine. So just run kw bd to compile and install a upstream kernel for
Raspberry Pi 4.

Let’s show you how easy is to build, install and test a custom kernel for Steam Deck with Kworkflow. It’s a live demo, but I also recorded it because I know the risks I’m exposed to and something can go very wrong just because of reasons :)
For this live demo, I took my OLED Steam Deck to the stage. I explained that, if I boot mainline kernel on this device, there is no audio. So I turned it on and booted the mainline kernel I’ve installed beforehand. It was clear that there was no typical Steam Deck startup audio when the system was loaded.

As I started the demo in the kw environment for Raspberry Pi 4, I first moved to another environment previously used for Steam Deck. In this STEAMDECK environment, the mainline kernel was already compiled and cached, and all settings for accessing the target machine, compiling and installing a custom kernel were retrieved automatically.
My live demo followed these steps:
With kw env --use STEAMDECK, switch to a kworkflow environment for Steam
Deck kernel development.
With kw b -i, shows that kw will compile and install a kernel with 285
modules named 6.17.0-rc6-mainline-for-deck.
Run kw config to show that, in this environment, kw configuration changes
to x86 architecture and without cross-compilation.
Run kw device to display information about the Steam Deck device, i.e. the
target machine. It also proves that the remote access - user and IP - for
this Steam Deck was already configured when using the STEAMDECK environment, as
expected.
Using git am, as usual, apply a hot fix on top of the mainline kernel.
This hot fix makes the audio play again on Steam Deck.
With kw b, build the kernel with the audio change. It will be fast because
we are only compiling the affected files since everything was previously
done and cached. Compiled kernel, kw configuration and kernel configuration is
retrieved by just moving to the “STEAMDECK” environment.
Run kw d --force --reboot to deploy the new custom kernel to the target
machine. The --force option enables us to install the mainline kernel even
if mkinitcpio complains about missing support for downstream packages when
generating initramfs. The --reboot option makes the device reboot the Steam
Deck automatically, just after the deployment completion.
After finishing deployment, the Steam Deck will reboot on the new custom kernel version and made a clear resonant or vibrating sound. [Hopefully]
Finally, I showed to the audience that, if I wanted to send this patch
upstream, I just needed to run kw send-patch and kw would automatically add
subsystem maintainers, reviewers and mailing lists for the affected files as
recipients, and send the patch to the upstream community assessment. As I
didn’t want to create unnecessary noise, I just did a dry-run with kw
send-patch -s --simulate to explain how it looks.
In this presentation, I showed that kworkflow supported different kernel development workflows, i.e., multiple distributions, different bootloaders and architectures, different target machines, different debugging tools and automatize your kernel development routines best practices, from development environment setup and verifying a custom kernel in bare-metal to sending contributions upstream following the contributions-by-e-mail structure. I exemplified it with three different target machines: my ordinary x86 AMD laptop with Debian, Raspberry Pi 4 with arm64 Raspbian (cross-compilation) and the Steam Deck with SteamOS (x86 Arch-based OS). Besides those distributions, Kworkflow also supports Ubuntu, Fedora and PopOS.
Now it’s your turn: Do you have any secret recipes to share? Please share with us via kworkflow.
We’ve reached Q4 of another year, and after the mad scramble that has been crunch-time over the past few weeks, it’s time for SGC to once again retire into a deep, restful sleep.
2025 saw a lot of ground covered:
It’s been a real roller coaster ride of a year as always, but I can say authoritatively that fans of the blog, you need to take care of yourselves. You need to use this break time wisely. Rest. Recover. Train your bodies. Travel and broaden your horizons. Invest in night classes to expand your minds.
You are not prepared for the insanity that will be this blog in 2026.
Today marks the first post of a type that I’ve wanted to have for a long while: a guest post. There are lots of graphics developers who work on cool stuff and don’t want to waste time setting up blogs, but with enough cajoling they will write a single blog post. If you’re out there thinking you just did some awesome work and you want the world to know the grimy, gory details, let me know.
The first victimrecipient of this honor is an individual famous for small and extremely sane endeavors such as descriptor buffers in Lavapipe, ray tracing in Lavapipe, and sparse support in Lavapipe. Also wrangling ray tracing for RADV.
Below is the debut blog post by none other than Konstantin Seurer.
Apitrace is a powerful tool for capturing and replaying traces of GL and DX applications. The problem is that it is not really suitable for performance testing. This blog post is about implementing a faster method for replaying traces.
About six weeks ago, Mike asked me if I wanted to work on this.
[6:58:58 pm] <zmike> on the topic of traces
[6:59:08 pm] <zmike> I have a longer-term project that could use your expertise
[6:59:19 pm] <zmike> it's low work but high complexity
[7:00:12 pm] <zmike> specifically I would like apitrace to be able to competently output C code from traces and to have this functionality merged upstream
low work
Sure. 
glretraceThis first obvious step was measuring how glretrace currently performs. Mike kindly provided a couple of traces from his personal collection, and I immediately timed a trace of the only relevant OpenGL game:
$ time ./glretrace -b minecraft-perf.trace
/Users/Cortex/Downloads/graalvm-jdk-23.0.1+11.1/bin/java
Rendered 1261 frames in 10.4269 secs, average of 120.937 fps

real    0m10.554s
user    0m12.938s
sys     0m2.712s
This looks fine, but I have no idea how fast the application is supposed to run. Running the same trace with perf reveals that there is room for improvement.
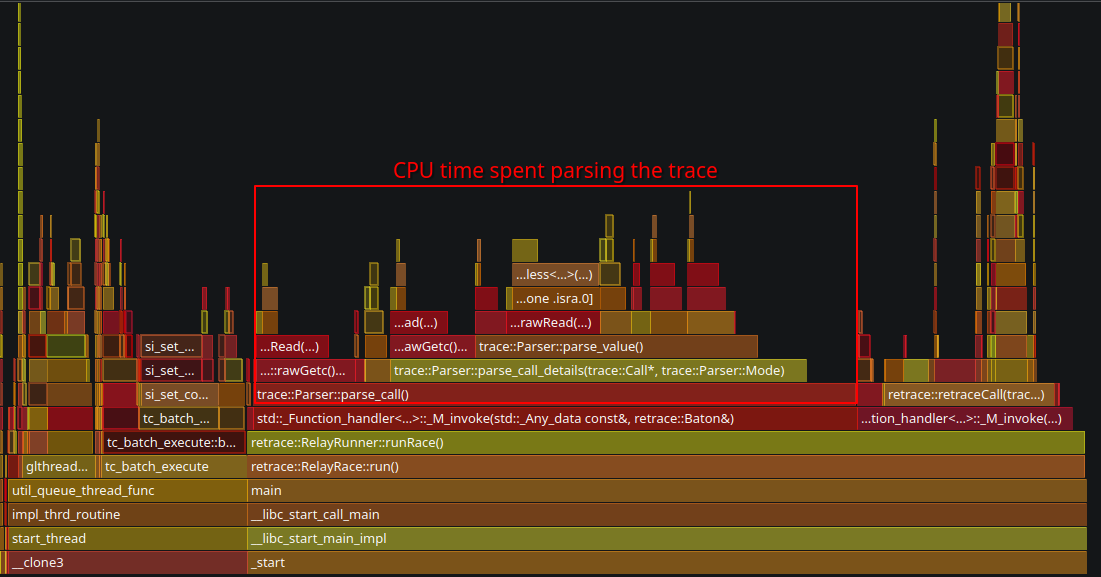
2/3 of frametime is spent parsing the trace.
An apitrace trace stores API call information in an object-oriented style. This makes basic codegen really easy because the objects map directly to the generated C/C++ code. However, not all API calls are made equal, and the countless special cases that I needed to handle are what made this project take so long.
glretrace has custom implementations for WSI API calls, and it would be a shame not to use them. The easiest way of doing that is generating a shared library instead of an executable and having glretrace load it. The shared library can then provide a bunch of callbacks for the call sequences we can do codegen for and Call objects for everything else.
Besides WSI, there are also arguments and return values that need special treatment. OpenGL allows the application to create all kinds of objects that are represented using IDs. Those IDs are assigned by the driver, and they can be different during replay. glretrace remaps them using std::maps which have non-trivial overhead. I initially did that as well for the codegen to get things up and running, but it is actually possible to emit global variables and have most of the remapping run logic during codegen.
With the main replay overhead being taken care of, a major amount of replay time is now spent loading texture and buffer data. In large traces, there can also be >10GiB of data, so loading everything upfront is not an option. I decided to create one thread for reading the data file and nproc decompression threads. The read thread will wait if enough data has been loaded to limit memory usage. Decompression threads are needed because decompression is slower than reading the compressed data.
The results speak for themselves:
$ ./glretrace --generate-c minecraft-perf minecraft-perf.trace
/Users/Cortex/Downloads/graalvm-jdk-23.0.1+11.1/bin/java
Rendered 0 frames in 79.4072 secs, average of 0 fps
$ cd minecraft-perf
$ echo "Invoke the superior build tool"
$ meson build --buildtype release
$ ninja -Cbuild
$ time ../glretrace build/minecraft-perf.so
info: Opening 'minecraft-perf.so'... (0.00668795 secs)
warning: Waited 0.0461142 secs for data (sequence = 19)
Rendered 1261 frames in 5.19587 secs, average of 242.693 fps

real    0m5.415s
user    0m5.429s
sys     0m4.983s
Nice.
Looking at perf most CPU time is now spent in driver code or streaming binary data for stuff like textures on a separate thread.
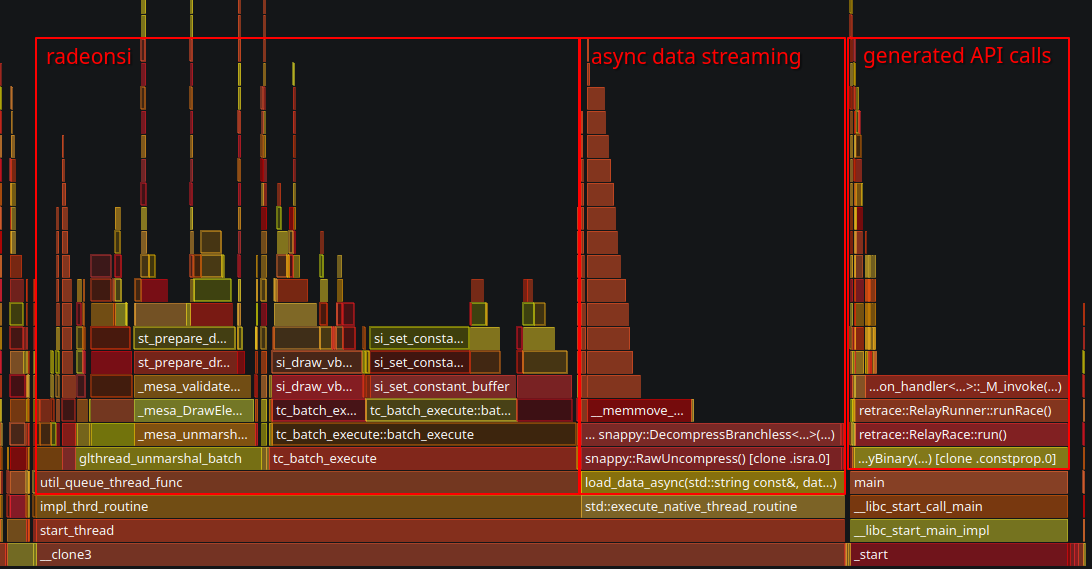
If you are interested in trying this out yourself, feel free to build the upstream PR and report on bugs unintended features. It would also be nice to have DX support in the future, but that will be something for the dxvk developers unless I need something to procrastinate from doing RT work.
- Konstantin
Hi!
I skipped last month’s status update because I hadn’t collected a lot of interesting updates and I’ve dedicated my time to writing an announcement for the first vali release.
Earlier this month, I’ve taken the train to Vienna to attend XDC 2025. The conference was great, I really enjoyed discussing face-to-face with open-source graphics folks I usually only interact with online, and meeting new awesome people! Since I’m part of the X.Org Foundation board, it was also nice to see the fruit of our efforts. Many thanks to all organizers!

We’ve discussed many interesting topics: a new API for 2D acceleration hardware, adapting the Wayland linux-dmabuf protocol to better support multiple GPUs, some ways to address current Wayback limitations, ideas to improve libliftoff, Vulkan use in Wayland compositors, and a lot more.
On the wlroots side, I’ve worked on a patch to fallback to the renderer to apply gamma LUTs when the KMS driver doesn’t support them (this also paves the way for applying color transforms in KMS). Félix Poisot has updated wlroots to support the gamma 2.2 transfer function and use it by default. llyyr has added support for the BT.1886 transfer function and fixed direct scanout for client using the gamma 2.2 transfer function.
I’ve sent a patch to add support for DisplayID v2 CTA-861 data blocks, required for handling some HDR screens. I’ve reviewed and merged a bunch of gamescope patches to avoid protocol errors with the color management protocol, fix nested mode under a Vulkan compositor, fix a crash on VT switch and modernize dependencies.
I’ve worked a bit on drm_info too. I’ve added a JSON schema to describe the shape of the JSON objects, made it so EDIDs are included in the JSON output as base64-encoded strings, and added the EDID make/model/serial + bus info to the pretty-printed output.
delthas has added soju support for user metadata, introduced a new work-in-progress metadata key to block users, and made it so soju cancels Web Push notifications if a client marks a message as read (to avoid opening notifications for a very short time when actively chatting with another user). Markus Cisler has revamped Goguma’s message bubbles: they look much better now!
See you next month!
A while ago I wrote about the limited usefulness of SO_PEERPIDFD. for authenticating sandboxed applications. The core problem was simple: while pidfds gave us a race-free way to identify a process, we still had no standardized way to figure out what that process actually was - which sandbox it ran in, what application it represented, or what permissions it should have.
The situation has improved considerably since then.
Cgroups now support user extended attributes. This feature allows arbitrary metadata to be attached to cgroup inodes using standard xattr calls.
We can change flatpak (or snap, or any other container engine) to create a cgroup for application instances it launches, and attach metadata to it using xattrs. This metadata can include the sandboxing engine, application ID, instance ID, and any other information the compositor or D-Bus service might need.
Every process belongs to a cgroup, and you can query which cgroup a process belongs to through its pidfd - completely race-free.
Remember the complexity from the original post? Services had to implement different lookup mechanisms for different sandbox technologies:
/proc/$PID/root/.flatpak-infosnap routine portal-infoAll of this goes away. Now there’s a single path:
SO_PEERPIDFD to get a pidfd for the clientThis works the same way regardless of which sandbox engine launched the application.
It’s worth emphasizing: cgroups are a Linux kernel feature. They have no dependency on systemd or any other userspace component. Any process can manage cgroups and attach xattrs to them. The process only needs appropriate permissions and is restricted to a subtree determined by the cgroup namespace it is in. This makes the approach universally applicable across different init systems and distributions.
To support non-Linux systems, we might even be able to abstract away the cgroup details, by providing a varlink service to register and query running applications. On Linux, this service would use cgroups and xattrs internally.
The old approach - creating dedicated wayland, D-Bus, etc. sockets for each app instance and attaching metadata to the service which gets mapped to connections on that socket - can now be retired. The pidfd + cgroup xattr approach is simpler: one standardized lookup path instead of mounting special sockets. It works everywhere: any service can authenticate any client without special socket setup. And it’s more flexible: metadata can be updated after process creation if needed.
For compositor and D-Bus service developers, this means you can finally implement proper sandboxed client authentication without needing to understand the internals of every container engine. For sandbox developers, it means you have a standardized way to communicate application identity without implementing custom socket mounting schemes.


